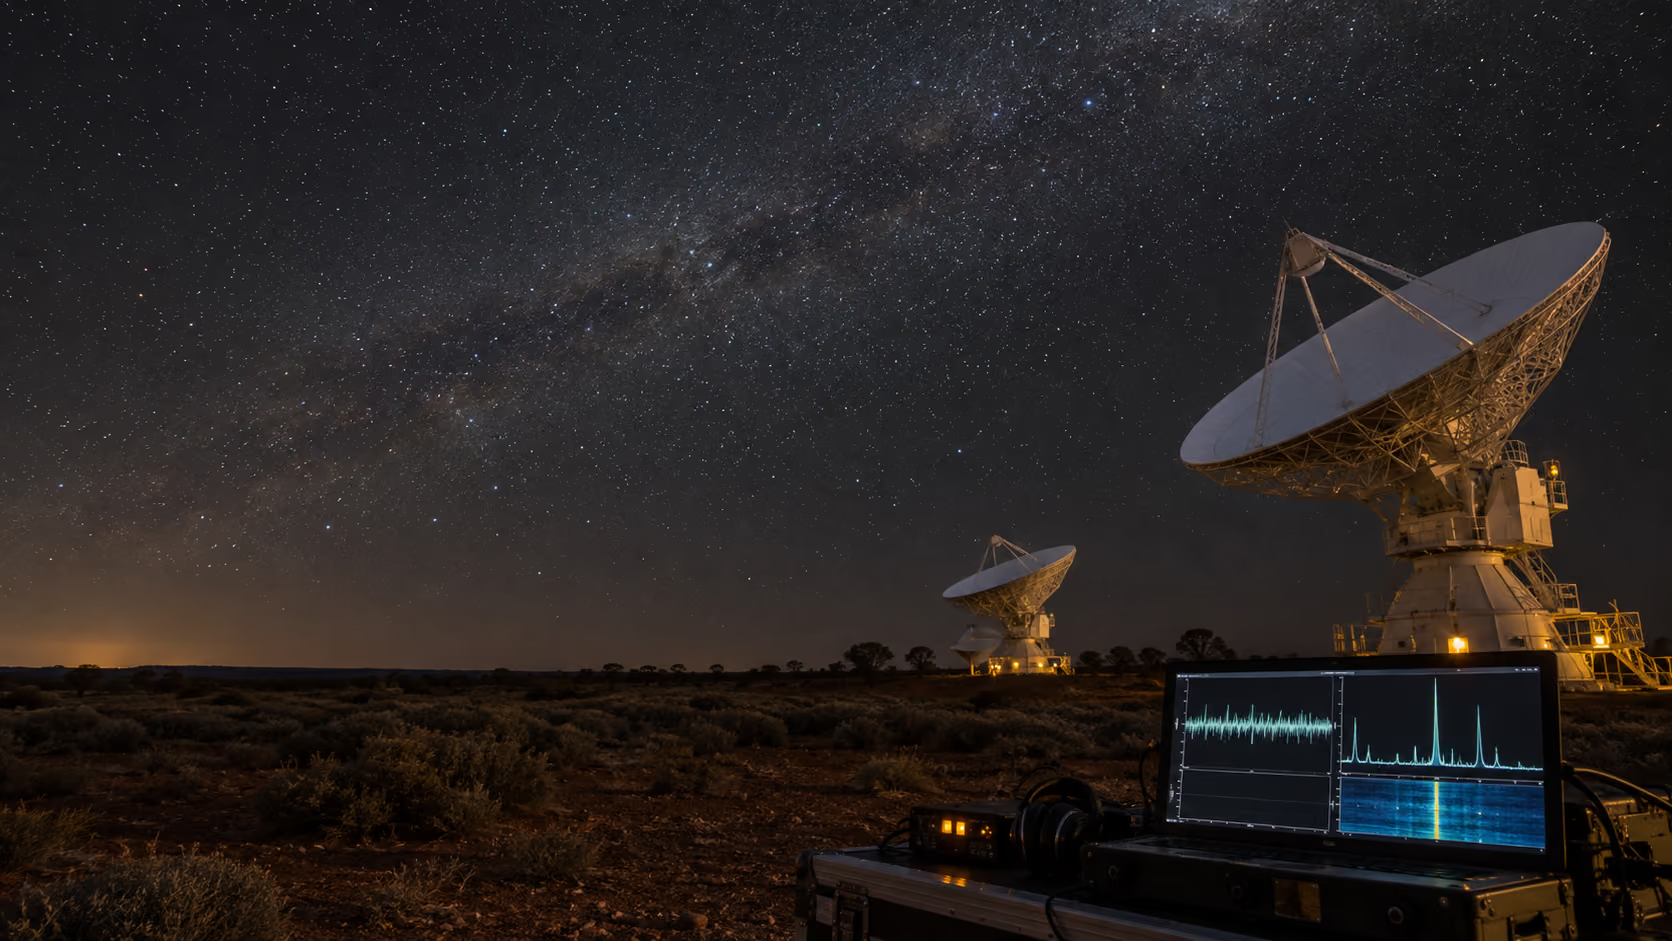
A studio course in astronomical data sonification: trace signals from telescope to speaker, design accountable mappings, and build a listening instrument that never hides its data.
A studio in accountable sonification
Turn astronomical data into sound without hiding the translation.
Students work like instrument builders: begin with a measured question, expose every operation, then test whether a listener can recover the intended pattern. Musical polish is welcome only after the evidence remains inspectable.
- Level
- Third-year studio
- Duration
- 12 weeks
- Prior audio
- Not required
- Final work
- Public listening instrument
The course position
Data does not sing by itself.
A telescope records measurements, not music. Every sound you make in this course must reveal its source, mapping and uncertainty, so a listener can tell what belongs to the universe and what belongs to your design.
A repeatable method
The signal chain
- ObserveFind the measured quantity and its limits.
- MapChoose what becomes pitch, time, timbre or space.
- ListenTest what a listener can actually distinguish.
- DisclosePublish the values, operations and uncertainty.
The semester as one investigation
Twelve observations, one claim under pressure
Each week changes the data object and the failure worth noticing. The signal chain stays visible, so techniques accumulate instead of resetting.
Read the chain
Signal, provenance, mapping and periodicity
- W01Can space be heard?What exactly are we hearing when an astronomical dataset becomes sound?DATAsynthetic light curveLAB OUTPUTan annotated comparison of two mappings
- W02From telescope to speakerWhich transformations happen before a telescope measurement reaches a listener?DATAcalibrated detector time seriesLAB OUTPUTa provenance diagram with transformations labelled
- W03Mapping numbers to soundWhen does a sonic mapping preserve an order, difference or pattern in the data?DATAnormalized scalar sequenceLAB OUTPUTa tested mapping matrix and selected rule
- W04The clocks of pulsarsHow can timing reveal a pulsar without turning its regularity into a beat fiction?DATAfolded pulsar pulse profileLAB OUTPUTa pulsar profile and an audification note
Work across media
Radio, strain, images and spectra
- W05The noisy SunHow do we distinguish a solar radio event from noise, interference and instrument drift?DATAsolar radio dynamic spectrumLAB OUTPUTan uncertainty-aware dynamic-spectrum sketch
- W06The gravitational-wave chirpWhy does a gravitational-wave event sound like a chirp, and which parts are transformed?DATAGW150914 strain time seriesLAB OUTPUTa blind comparison of three chirp transformations
- W07Listening to lightWhat can an image scan communicate when the listener cannot see the source image?DATAChandra Deep Field imageLAB OUTPUTa storyboard for an image sonification
- W08Spectra, colour and redshiftCan a listener compare spectra without confusing wavelength with musical harmony?DATAone-dimensional emission spectrumLAB OUTPUTa paired-spectrum listening test
Make a public claim
Uncertainty, access, rhetoric and release
- W09Noise, gaps and uncertaintyHow can uncertainty remain perceptible without overwhelming the measured pattern?DATAlight curve with error bars and gapsLAB OUTPUTan uncertainty prototype with a recognition result
- W10Accessibility beyond the graphWho gains and who is excluded when sound becomes the primary representation?DATAmultimodal transit datasetLAB OUTPUTa multimodal access audit and revision
- W11When sonification liesAt what point does a compelling listening experience become a misleading scientific claim?DATApaired honest and deceptive mappingsLAB OUTPUTa completed disclosure checklist and revised prototype
- W12The cosmic listening roomCan a public listener understand both the astronomical pattern and how its sound was made?DATAstudent-curated astronomical datasetLAB OUTPUTa public instrument and observed listening record
Try the method before enrolling
Listening Lab: one curve, two mappings
The source stays fixed while one design decision changes. Listen, inspect the values, then decide which mapping supports the stated task.
Synthetic teaching data · 10 samples
Relative brightness over time
Without looking at the values, locate the lowest region. Then inspect whether the mapping preserved value, timing or both.
- Source
- Synthetic relative brightness, 0.83–1.00
- Pitch rule
- Brightness maps linearly to 220–660 Hz; samples remain 320 ms apart.
- Rhythm rule
- Pitch stays at 392 Hz; lower brightness creates a longer 180–520 ms interval.
- Constant
- Sine timbre, 120 ms note; speed changes playback only
These values are invented for learning. They resemble a transit-shaped dip but do not represent a discovered planet.
A tool you keep
The Sonification Field Guide
One reusable record for provenance, mapping, listening evidence and release checks. It follows every project from first values to public instrument.
Assessment is the build sequence
Four submissions, one instrument
Small mapping experiments become a signal study, then a critique, then a public work. Nothing is assigned only to be discarded.
- 01Listening NotebookFour compact experiments that establish a vocabulary for source, mapping and listening evidence.
- 02Pulsar Signal StudyAnalyse one periodic radio signal and defend the transformations used to make its timing audible.
- 03Sonification CritiqueAudit a published astronomical sonification by reconstructing its mapping and testing its claim.
- 04Cosmic Listening InstrumentDesign, test and publish an interactive instrument that makes one astronomical pattern audible and accountable.