Five clients, five homes
Every student advises one of five households applying to the loan programme. The homes are fixed existing properties; the climates are real; the families are fictional.
Teaching fiction. The households, their properties and the specialists who measure them are invented for this course. The climates behind them are Bureau of Meteorology long-term statistics, and every engineering method applied to them is real.
You choose one home in week 1 and work on it all semester. Every home comes with the same kit: an intake dossier with scaled plans in week 1 (Release A), and a specialist team's findings after a fictional measurement year in week 7 (Release B). Every student who chooses a home receives the same Release B, whatever their own measurement programme proposed.
There are only these five. You cannot propose another site, substitute land, or enlarge a roof or a plot. What you can change is set out on each dossier and on the method page.
How to use this page
5 steps
Five steps. How to read a client home and what to take from it.
Step 1 Choose one home, once
Five existing homes in five Australian climates. There is no sixth option and no custom site. You keep the same client all semester, because the comparison between homes is part of what the course teaches.
Step 2 Read the plan to scale
Each home's page carries a scaled site plan and floor plan with a north arrow and a scale bar. Roof plan area, connected roof area and footprint are three different numbers — a design that confuses them is wrong by a large factor.
Step 3 Tell a fact from an assumption
Every dossier fact is tagged known, estimate or still to be measured. Copy those tags into your workbook and do not promote them. The unknowns are the seed of Assignment 1.
Step 4 Two releases per home
Release A is the week 1 intake dossier: the property, the inventory, the constraints and the client's own targets. Release B is the specialist findings handed over in week 7, with the measured year as CSV. Both are linked from each home's page.
Step 5 Their priorities, not yours
Each household states what it actually wants. The retrofit you recommend has to meet those targets, not the ones that would score well.
Choose a home
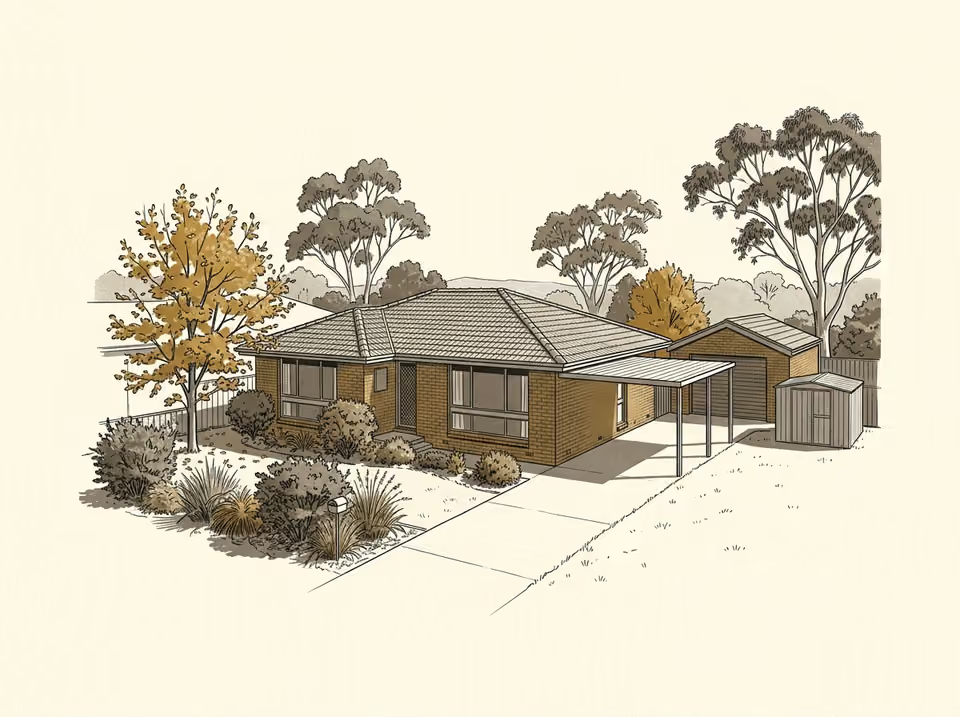
Canberra: the Taylor household
Single-storey brick-veneer house (1978) with a detached garage, carport and garden shed.
Keep the fruit trees and the raised beds productive through summer without watering from the mains.
Conceptual illustration · scaled plans govern.
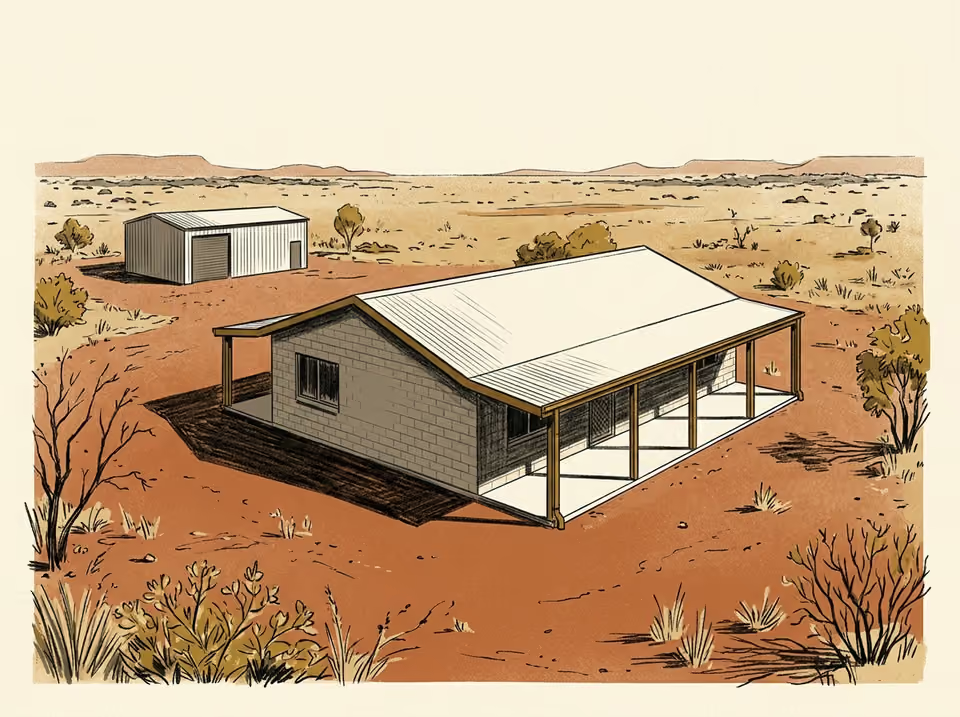
Alice Springs: the Nguyen household
Blockwork house (1994) with deep verandahs and a steel machinery shed on a 2 ha block.
Cart as little water as possible, and none at all in an ordinary year if that can be done.
Conceptual illustration · scaled plans govern.
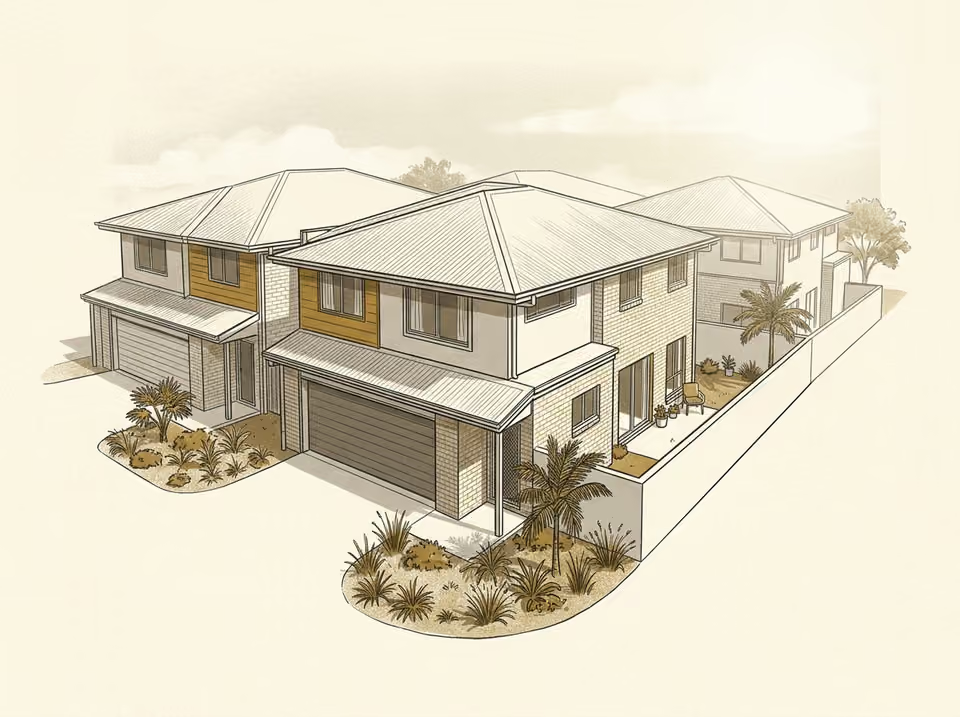
Brisbane: the Patel household
Two-storey townhouse (2006) with an internal garage, in a nine-lot community titles scheme.
Grow something worthwhile in a small space without losing the courtyard.
Conceptual illustration · scaled plans govern.
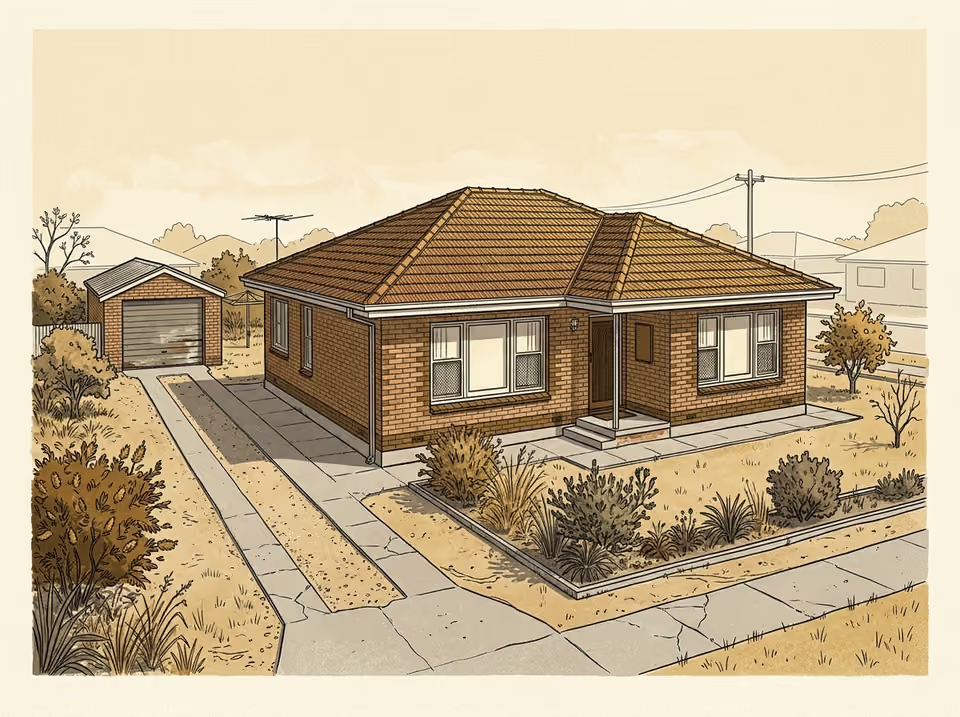
Adelaide: the Rossi household
Double-brick house (1965) with a detached garage reached by a side driveway.
Reliable summer irrigation for the beds and fruit trees without a rising water bill.
Conceptual illustration · scaled plans govern.
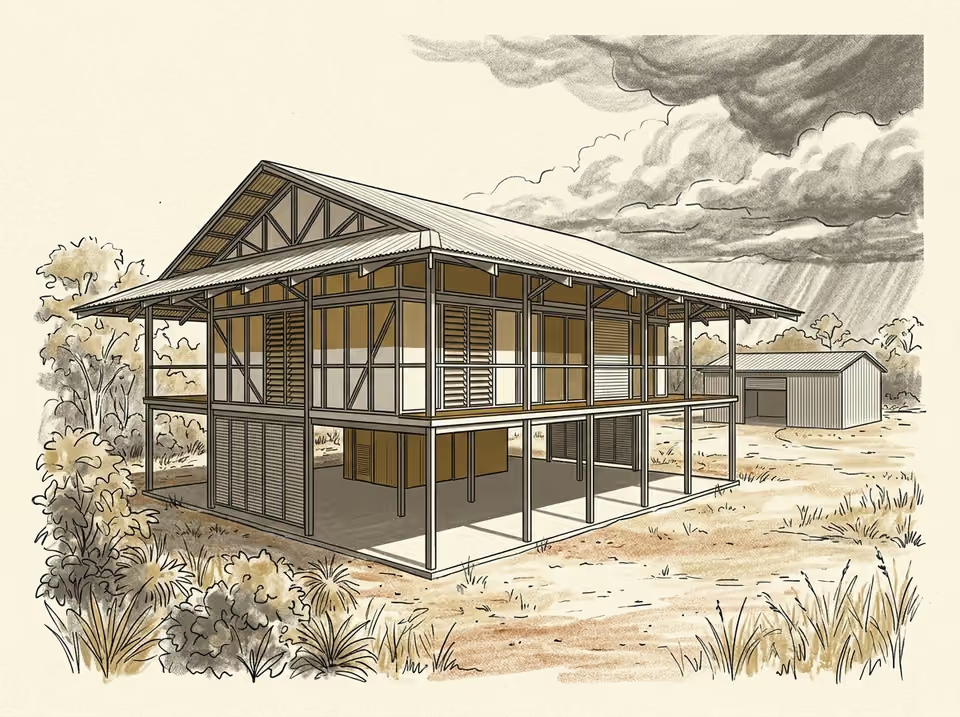
Darwin: the Williams household
Elevated steel-frame house (2008) and a steel shed on a 1 ha block.
Carry enough of the wet season into the dry to stop buying water.
Conceptual illustration · scaled plans govern.
The five side by side
| Home | Canberra | Alice Springs | Brisbane | Adelaide | Darwin |
|---|---|---|---|---|---|
| Client | Taylor | Nguyen | Patel | Rossi | Williams |
| Whole plot | 800 m² | 2 ha | 300 m² | 700 m² | 1 ha |
| Designated growing area | 443 m² | 408 m² | 88 m² + 40 m² shared | 261 m² | 506 m² |
| Roof plan area | 296 m² | 351 m² | 168 m² | 229 m² | 305 m² |
| Connected today | 42 m² | 98 m² | 71 m² | 37 m² | 124 m² |
| Existing storage | 5 kL | 22 kL | 3 kL | 5 kL | 45 kL |
| Other water | mains | bore, 100 kL/yr | mains | mains | carted |
| Station | 070014 | 015590 | 040214 | 023000 | 014015 |
| Mean annual rain | 616 mm | 284 mm | 1,146 mm | 525 mm | 1,733 mm |
| Rain in driest four months | 28.0 % | 16.4 % | 18.8 % | 17.1 % | 1.4 % |
| Annual ETo | 1,244 mm | 1,803 mm | 1,353 mm | 1,207 mm | 1,620 mm |
| Care available | 2 h/week | 4 h/week | 3 h/week | 3 h/week | 4 h/week |
The largest designated growing area is Darwin's 500 m² or so; the largest whole plot is the 2 ha Alice Springs parcel, most of which is retained vegetation. Neither number says what a household can feed itself from. That depends on the crop, the water, the soil, the hours and the season, and it is worked out home by home in weeks 4 and 9.
Why these five
They span a cool inland suburb, an arid rural block, a subtropical townhouse, a Mediterranean suburb and a tropical wet-dry block, so between them they cover the problems the course teaches: frost, water scarcity, space and approvals, seasonal mismatch, and storage timing. Different constraints make different homes easier or harder in context. Each leads two teaching weeks, and every week from 2 to 11 compares all five.
Realistic parameters cannot make these climates equally hard, and the course does not pretend to. Fairness comes from the targets: each client's are set from the same model so that a feasible option exists at every home with a comparable margin, and the assessment rewards reasoning about your client, not a number compared across homes.