Tools, supplied datasets and further-reading pointers that support the modules and the Laboratory Portfolio — not the course's full bibliography.
This page collects what the course expects you to reach for while working, as distinct from References, which is the full bibliography behind the course’s factual and quantitative claims.
Supplied datasets#
The Laboratory Portfolio’s “two supplied-dataset analyses” component uses two datasets built for this course, each clearly labelled as illustrative rather than measured (see each module’s own data-provenance note):
- Tapioca-pearl oscillatory rheology (used in Module 1) — storage modulus G′ and loss modulus G″ against time, for pearls cooked for three different durations, constructed to sit within published ranges for cooked starch gels (Steffe, 1996).
- Broth droplet-size distributions (used in Module 6) — droplet-size distributions for broths simmered at three intensities, for a Stokes’-law creaming-velocity analysis.
Both datasets are described in full, with the values you need, on their module pages — there is nothing further to download.
Tools#
The two Laboratory instruments — the Virtual Rheometer and the Crispness Phase Diagram — run entirely in the browser; no separate software installation is required to use them. For the Modelling Problem Sets and the Material Characterisation Report, any environment that can fit a curve and report a residual is sufficient: a spreadsheet’s solver, a scientific calculator, or a short script (Python with NumPy/SciPy, or equivalent) all satisfy the brief. The course does not require or endorse one specific tool.
Further reading, by topic#
A short, topic-grouped starting point — References gives the complete list with full citation detail:
- Rheology and flow behaviour — Steffe, Rheological Methods in Food Process Engineering; Walstra, Physical Chemistry of Foods.
- Gels, networks and emulsions — BeMiller & Whistler (Eds.), Starch: Chemistry and Technology; McClements, Food Emulsions; Winter & Chambon on the gel point.
- Transport and kinetics — Singh & Heldman, Introduction to Food Engineering; Damodaran & Parkin (Eds.), Fennema’s Food Chemistry.
- Glass transitions and stability — Roos, Phase Transitions in Foods; Williams, Landel & Ferry (WLF); Gordon & Taylor.
On the shelf#
Seven whole books worth having alongside the course, rather than citations behind one specific figure — a mix of accessible and research-level texts spanning the four-stage progression, each linked to its publisher or a library catalogue record:
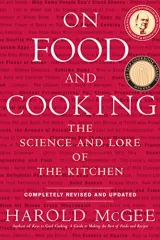
On Food and Cooking
The Science and Lore of the Kitchen
The classic, accessible bridge between the kitchen and the chemistry lab — a good first stop before the more technical texts below.
Publisher / catalogue page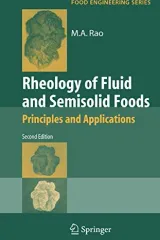
Rheology of Fluid and Semisolid Foods
Principles and Applications
A deeper, more mathematical treatment of the flow models the Virtual Rheometer fits.
Publisher / catalogue page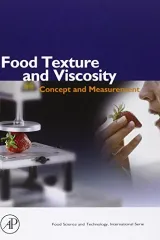
Food Texture and Viscosity
Concept and Measurement
The standard reference for how texture itself is defined and measured — the vocabulary Module 2 builds on.
Publisher / catalogue page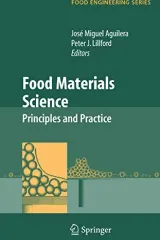
Food Materials Science
Principles and Practice
A materials-science lens on food structure, bridging the gel and emulsion material in Modules 4–6.
Publisher / catalogue page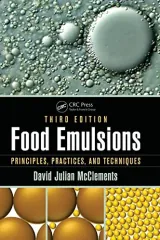
Food Emulsions
Principles, Practices, and Techniques
The field's standard text on how a stable emulsion is built and why it eventually fails — same source cited directly in References.
Publisher / catalogue page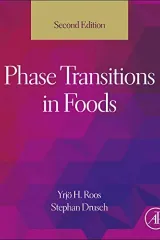
Phase Transitions in Foods
The reference for the glass transition and crispness material behind Modules 9–11 and the Crispness Phase Diagram.
Publisher / catalogue page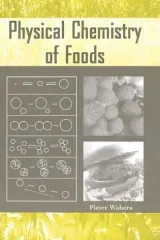
Physical Chemistry of Foods
Already cited directly in References — the single volume that spans nearly every topic this course touches.
Publisher / catalogue page