The claim
Every question this course asks starts from the same premise: texture is not only a matter of taste; part of it can be measured as a material property, governed by the same thermodynamics, transport equations and rheology used to characterise any soft material. That measurement explains part of what you taste — it does not replace your palate or a cook's judgement. A boba pearl's "QQ" bounce is a storage-to-loss modulus ratio. A spring roll's crunch is a material below its glass transition. Twelve modules take you from describing textures like these in words to measuring, explaining, predicting and redesigning them.
A journey through matter, structure and transformation
The teaching period runs in four stages, each three modules long, each building directly on the last — measurement, then structure, then transformation, then prediction and inverse design. Each stage's specimen is the material it's named for:
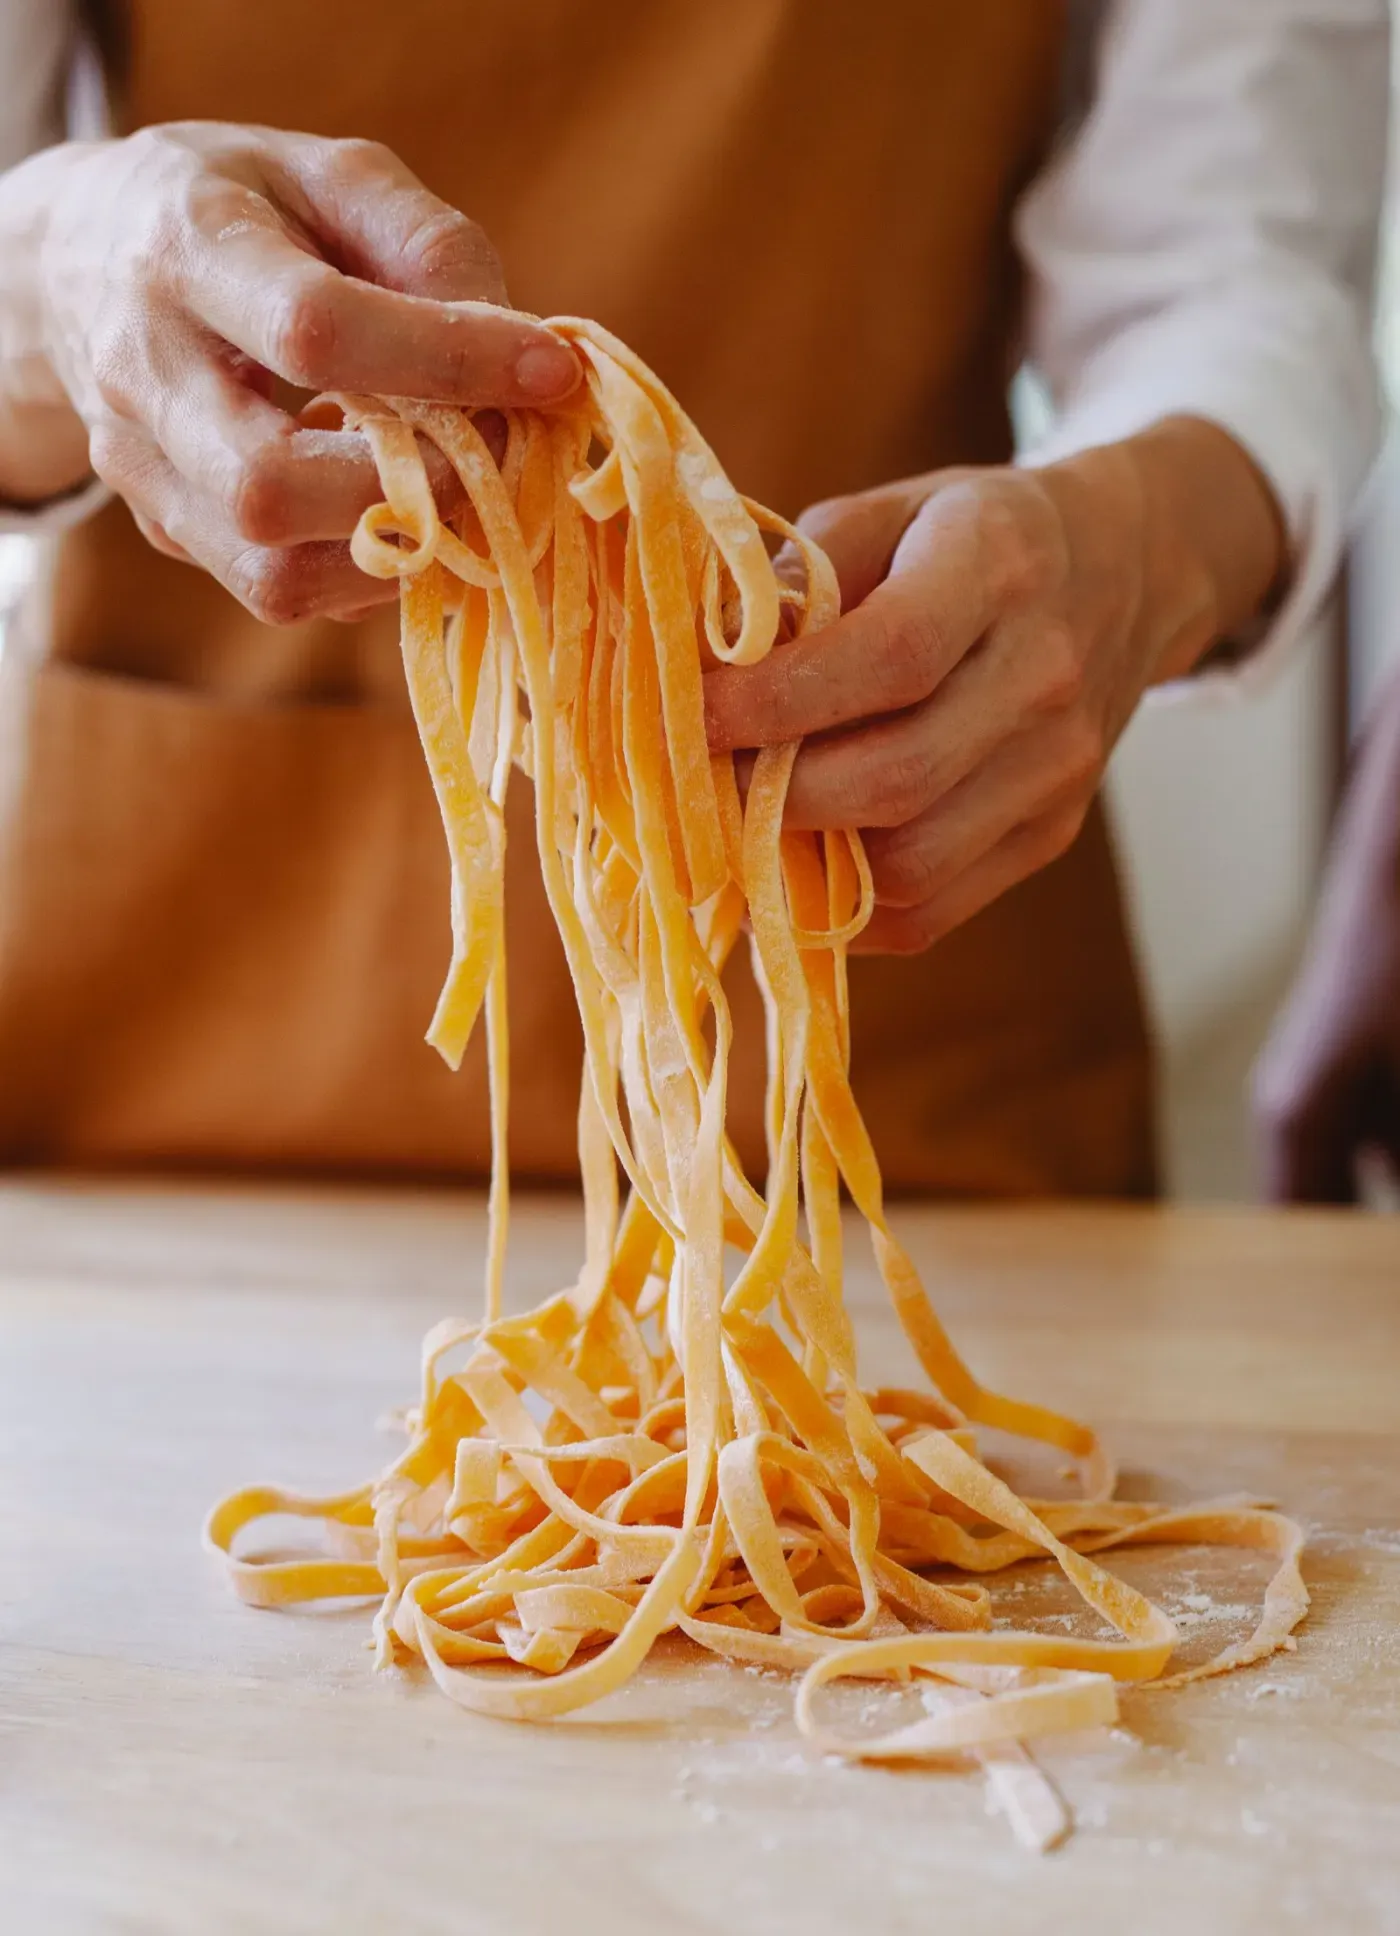
Specimen — hand-pulled doughDeformation under tension. Wheat dough is a viscoelastic gel: pulled slowly it stretches, pulled fast it tears — one specimen, two apparent materials. Stage 1 · Weeks 1–3
Measure
Measuring Edible Matter
How a physical chemist looks at a food material: definitions, flow curves and thermal signatures.
See the modules →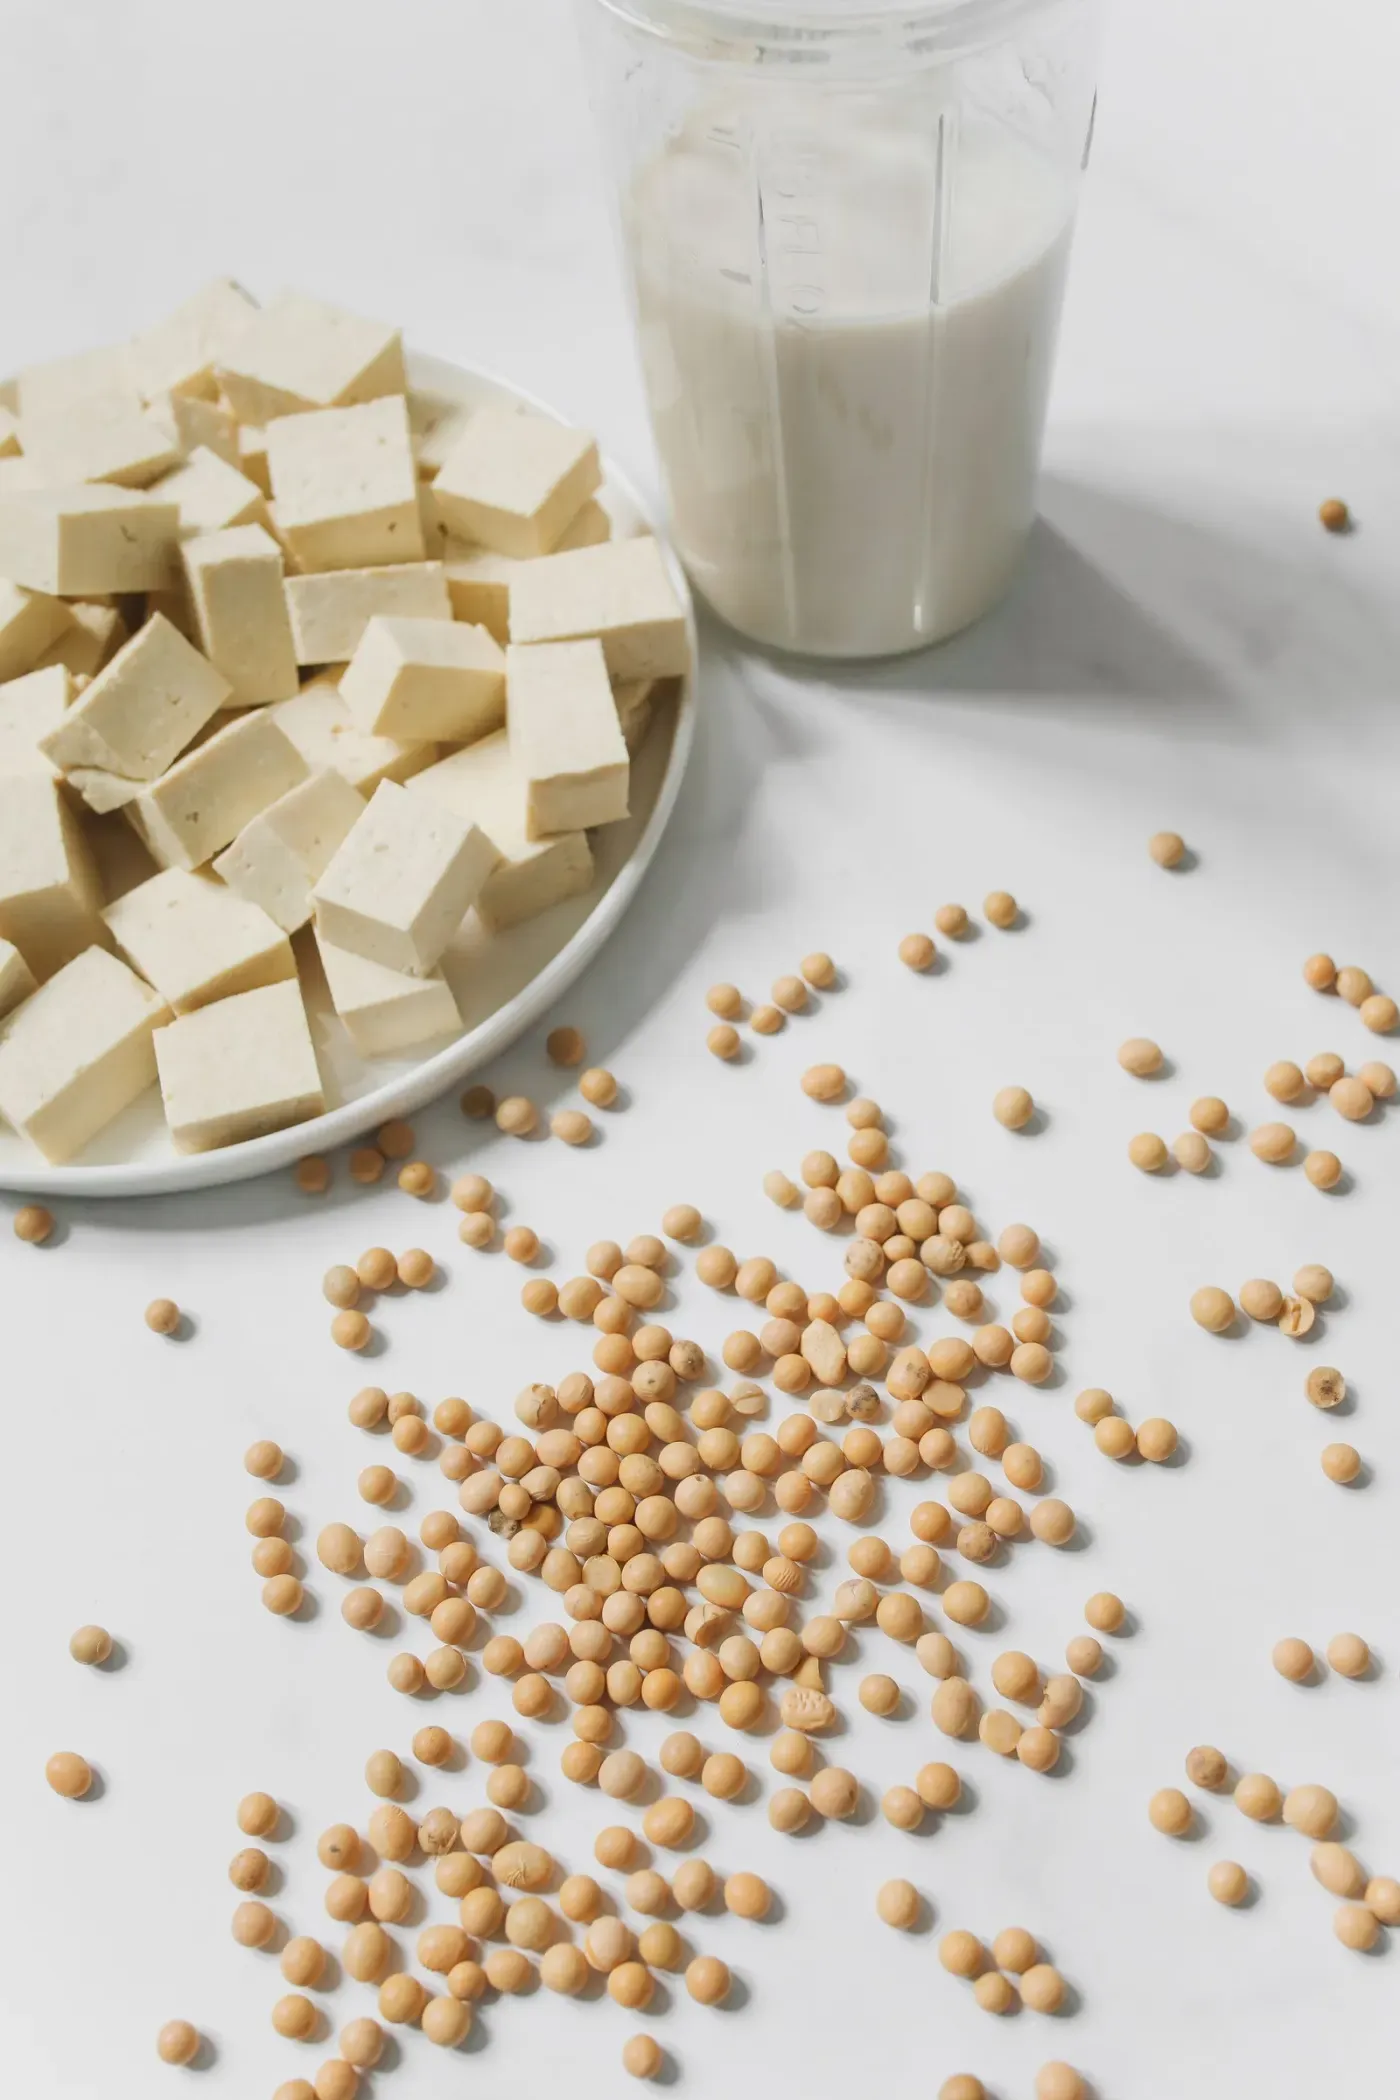
Specimen — protein gelA protein network holding water. Coagulated soy protein traps liquid inside a solid-like lattice — the same aggregation physics as an egg white or a cheese curd. Stage 2 · Weeks 4–6
Find structure
Structures and Networks
What gives a food material its structure: gel networks, aggregated proteins, dispersed phases.
See the modules →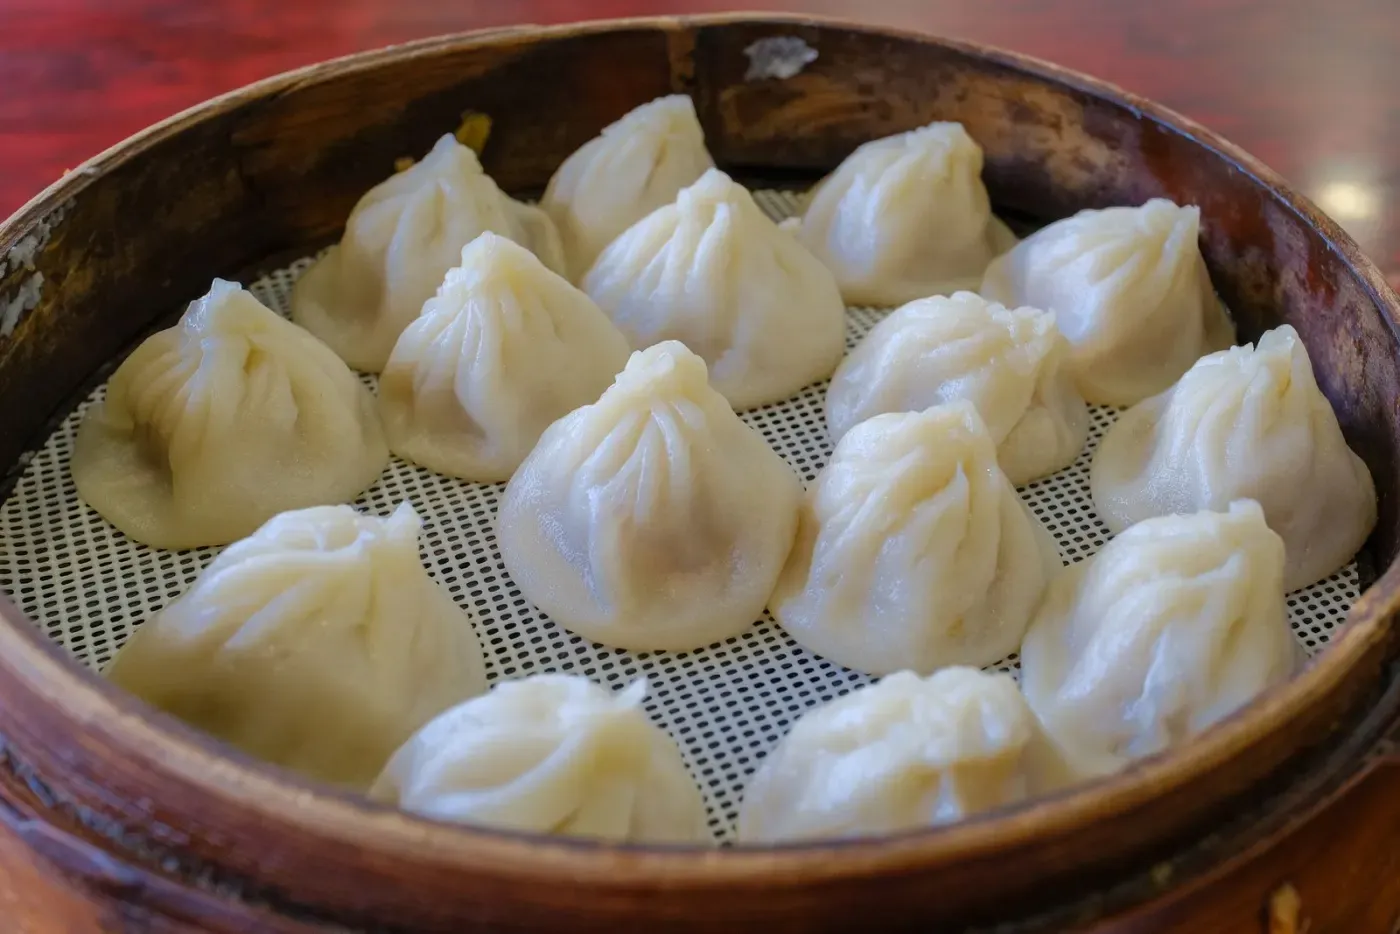
Specimen — heat & moisture transportA moving boundary. Heat diffuses in, moisture migrates, and a phase front sweeps through the wrapper and filling as the dumpling cooks. Stage 3 · Weeks 7–9
Transform
Transport, Kinetics and Transformation
How that structure changes during cooking: transport, reaction kinetics and phase transitions.
See the modules →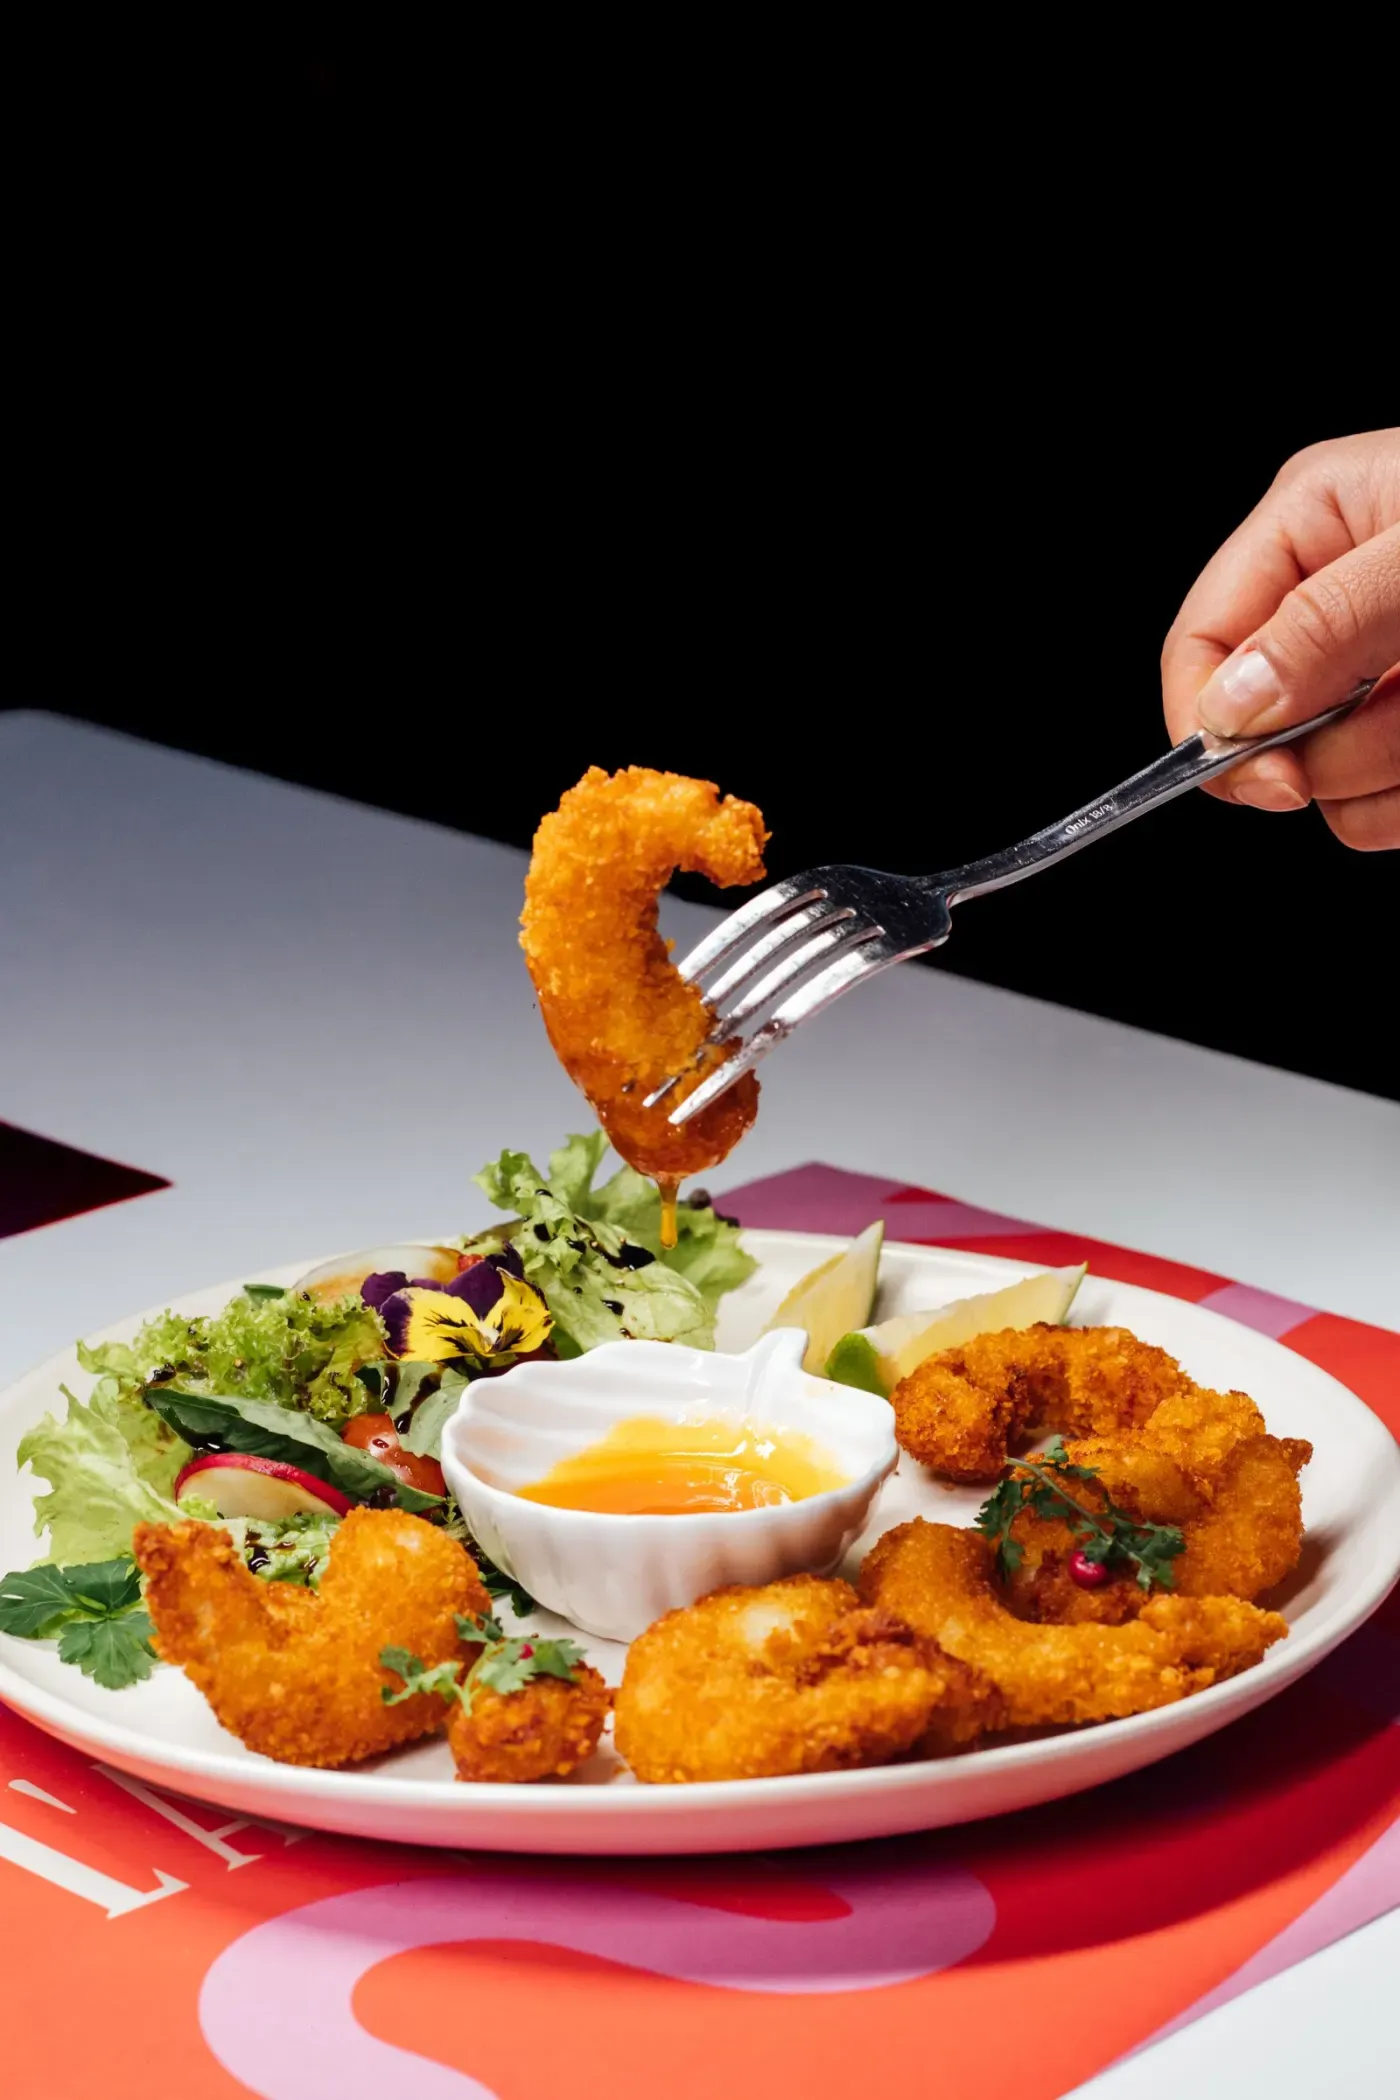
Specimen — glassy fractureA crisp material is a frozen liquid. Below its glass transition a starchy crust fractures instead of bending — every fracture is a crack propagating through a metastable solid. Stage 4 · Weeks 10–12
Predict & design
Prediction and Material Design
Fitting models to data, mapping a design space, and inverting the problem to engineer a texture.
See the modules →
See the full week-by-week breakdown in Modules.
Two instruments, not two dozen
Rather than one simulation per module, the course concentrates its interactive work into two instruments used repeatedly across the Laboratory Portfolio. Both are built to the same honesty standard as the written modules — labelled assumptions, visible fit quality, no invented data.
Virtual Rheometer
Sweep shear rate across a simulated soft material, fit Newtonian, power-law and Herschel-Bulkley models to the flow curve, and read the residual plot to see which fit actually holds.
Crispness Phase Diagram
Move a specimen through a temperature-moisture state diagram and watch it cross from the glassy, crisp region into the rubbery, softened one as it absorbs humidity.
Where the marks are
Assessment is staged the same way the curriculum is: earlier, lower-stakes work builds toward the two pieces that carry most of the mark.