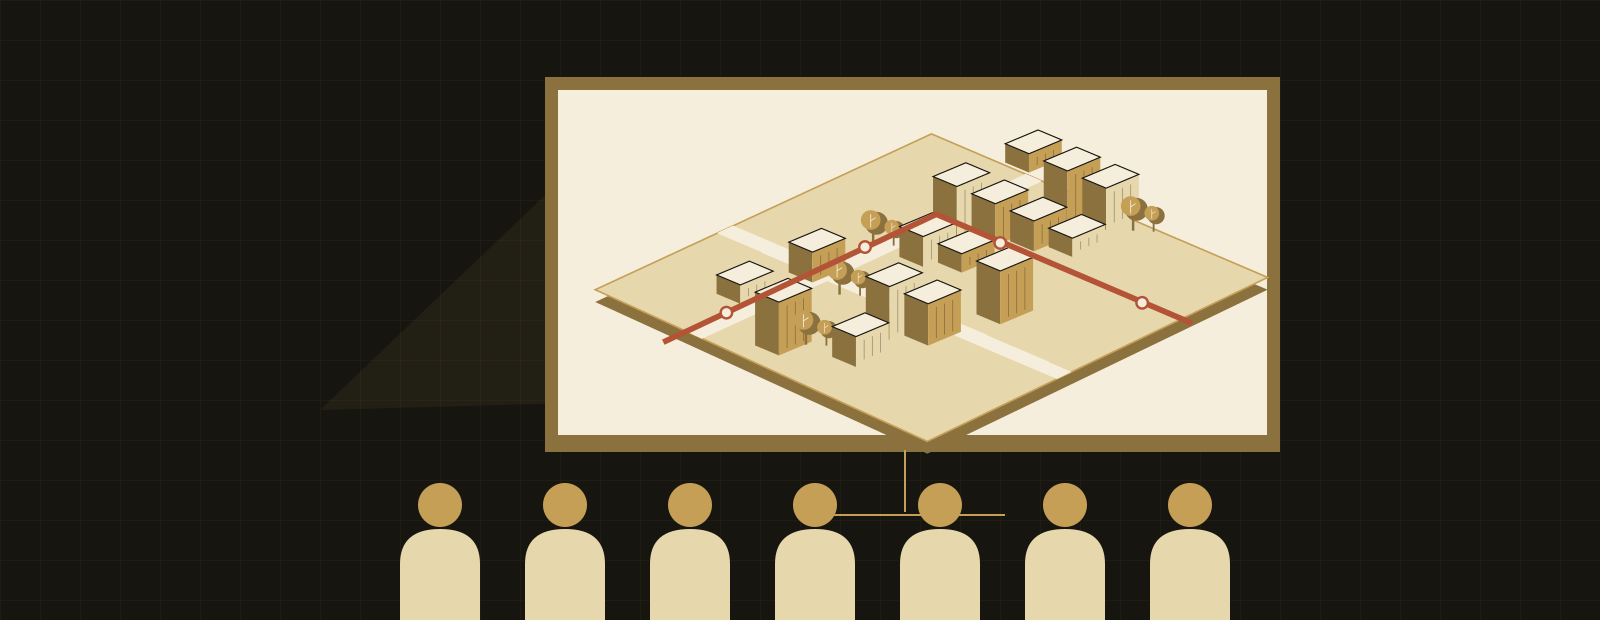
Transit-oriented density and the amenity radius — how far a resident will actually walk, and what therefore has to sit inside the circle.
15 March 2027
The argument#
A 15-minute city is not a distance, it is a claim about how a district spends its residents’ time and its own money, and the amenities that make the walk worth taking are precisely the ones that do not pay for themselves.
What you will learn#
- Draw a neighbourhood unit at Perry’s dimensions and state, in metres and in minutes, which amenities fall inside the walking radius and which do not.
- Distinguish density as a precondition for local amenity from density as a design goal, and cite the mechanism that connects the two.
- Calculate the monthly upkeep of the services placed inside a cell and compare it against the rate take that cell generates.
- Name the fiscal and livability consequences of a single amenity-siting decision, and defend the one chosen.
Theory into practice#
- Clarence Perry, “The Neighborhood Unit,” Regional Survey of New York and Its Environs, Vol. VII (1929). A residential cell of roughly 5,000 people on about 160 acres, elementary school at the centre, arterial roads on the boundary and never through it, shops at the corners where two cells meet.
- Carlos Moreno, Zaheer Allam, Didier Chabaud, Catherine Gall and Florent Pratlong, “Introducing the ‘15-Minute City’: Sustainability, Resilience and Place Identity in Future Post-Pandemic Cities,” Smart Cities 4(1), 2021. Four dimensions — proximity, diversity, density, ubiquity — organised around six social functions reachable in a quarter-hour on foot or by bicycle.
- Jane Jacobs, The Death and Life of Great American Cities (1961), Ch. 7 and Ch. 11. Four conditions generate diversity; the fourth is a sufficiently dense concentration of people.
- Cesare Marchetti, “Anthropological Invariants in Travel Behavior,” Technological Forecasting and Social Change 47(1), 1994. The roughly one-hour daily travel-time budget, stable across settlement patterns and centuries.
- Henry George, Progress and Poverty (1879), and the land-value-capture tradition after it. Improvements raise the value of land, and the question is who captures the increment.
The deck walks through where each of these lands, slide by slide, against the Halstead Reach cell.
Simulation mapping#
| Theory move | Cities: Skylines II mechanic | What students should watch happen |
|---|---|---|
| Perry’s cell with the school at its centre | The district tool, and the coverage radius drawn by a service building when selected | Whether the elementary school’s radius actually covers the cell it was sited for, or stops 200 m short of the eastern edge |
| Perry’s arterials on the boundary | Road hierarchy, and the traffic volume layer of the Traffic info view | Whether through movement on the Kerrow corridor stays on the cell boundary or has found a line through the middle of it |
| Moreno’s proximity, measured in minutes | Citizen daily schedules under the day/night cycle; pedestrian pathing between home, work, school and leisure | The share of trips a cim completes on foot before 09:00, and where the walk gives out |
| Jacobs’s sufficient concentration | Medium-density and mixed housing zones; the building level-up thresholds | Whether the ground-floor tenancies on Pelling Street hold their level or cycle through abandonment |
| George’s land-value increment | The Land Value info view, and the residential tax rate slider | The value gradient that appears around the new park within about a year, and what the rate take does after it |
| Marchetti’s time budget | The pathfinding cost a cim assigns to a trip; the average commute figures in the city information panel | Average commute time rising as the cell’s employment is pushed outside it |
Evidence standard. Named interface fields are direct readouts. Calculations shown from those fields are derived measures. Every fixed scenario value on this page is a worked hypothetical, not a captured run. See resources and evidence for access arrangements and worksheets.
The decision this week#
Livability against fiscal performance, forced by where the clinic goes: inside the cell, an easy walk the cell fully funds, or in a shared catchment, cheaper per cell but now a trip. The deck works both siting options’ upkeep and walk-time figures. There is no siting that gets both; students must choose one and say which metric they paid with.
Into the studio#
Monday is the assessed jury. Complete both three-cell clinic branches as homework before arrival. Upload the finished plan by 12:00, hang from 13:00, and defend the chosen branch at the jury. The lecture helps you articulate the evidence you have already prepared; it is not time to start the comparison. Follow Assessment 1 and the studio clock.
Assessment connection#
Feeds Assessment 1 — Neighbourhood Unit Plan directly, and every criterion of it. The amenity-radius material (slides 9–11) is the livability criterion, worth 40. The upkeep-against-rate-take arithmetic (slides 12–13) is the fiscal criterion, worth 30. The arterial-on-the-boundary material (slides 4–5, and the Traffic info view row of the mechanic mapping) is the mobility criterion, worth 30, and is deliberately the thinnest of the three here because Weeks 5 and 6 take it up properly before it returns as a criterion in the remaining two assessments.
Also builds toward Assessment 3 — Comprehensive City Plan: the cell is the unit the capstone assembles, and students who cannot defend one cell in Week 4 will be assembling twelve of them in Week 12.
Teaching team
- Marisol Quaye — convenor