Week 1: The dashboard as language
Why a dashboard is a designed language rather than a neutral report of facts, framed through the Jaguar E-Type and the Mercedes MBUX Hyperscreen
22 February 2027
Start with a question rather than a definition: when a dashboard shows you something, who decided what counts as worth showing, and how much of your attention it should cost? A fuel gauge and a check-engine light are both “information,” but not the same kind, and a dashboard that treated them identically would be a bad dashboard. This course studies that difference — call it a grammar — across a century of instrument design. Week 1 sets the terms the rest of the course will use.
A dashboard is an argument, not an inventory#
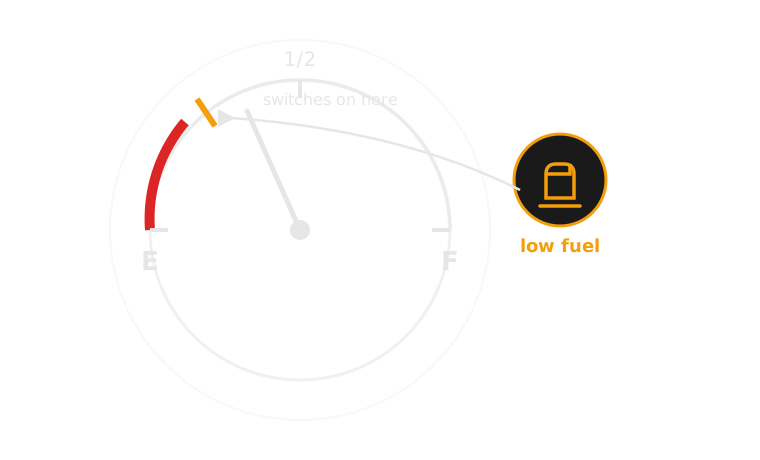
An analogue speedometer needle and a digital speed readout carry the same number but make different claims. The needle argues by position — its angle relative to redline is legible at a glance, without reading digits. The digital number argues by precision — exact, but requiring a half-second of literacy the needle doesn’t. Neither is more “true.” Each is a choice about what the driver needs under a specific kind of pressure: glance-legibility versus exactness. That choice is the language.
Constraint is the whole design problem#
A dashboard’s audience is a driver who is, by definition, mostly looking somewhere else. Every element competes for a few hundred milliseconds of peripheral or foveal attention, at speed, often at night, sometimes while frightened. A museum label can ask for sustained reading; a dashboard cannot. This is why the course is not a styling exercise — the interesting decisions are what gets a needle, what gets a light, what gets silence.
Five channels a dashboard can speak in#
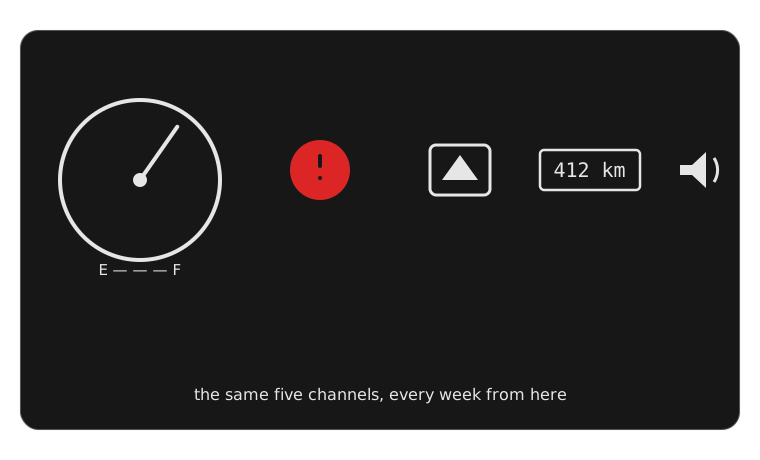
Every dashboard element is built from a small set of channels, and the choice between them is the design decision, not an implementation detail:
- needle / gauge — continuous, shows trend and rate of change
- discrete light (telltale) — binary, shows a threshold or fault state
- icon / pictogram — categorical, names what, not how much
- text — specific, but requires literacy and a moment of reading
- sound / voice — hard to miss, but can’t be glanced at and dismissed
Later weeks take each of these in turn — week 2 stays entirely inside the needle, week 3 is the light, week 4 the icon, week 6 the sound. This week’s job is just to notice the choice exists at all.
 needle — trendlight — thresholdicon — categorytext — exact valuesound — hard to miss
How an alert actually happens#
A dashboard warning is the visible end of a six-stage process, worth naming precisely because every later week revisits some stage of it. Most dashboard-design failures live in the gap between stage 3 and stage 4: a correctly detected, correctly prioritised event, communicated through the wrong channel.
1. Detect A sensor crosses a threshold — e.g. a pressure switch drops below a set point
2. Interpret The vehicle system classifies the event: normal range, a fault, or dangerous?
3. Prioritise An alert priority is assigned — informational, caution, or warning
4. Display A channel is chosen: needle movement, light, icon, text, sound, or a mix
5. Driver reads The driver recognises the alert and judges its urgency
6. Driver responds Ignore, monitor, or act — pull over, change behaviour
Case study: Jaguar E-Type (1961) vs Mercedes-Benz MBUX Hyperscreen (2021)#
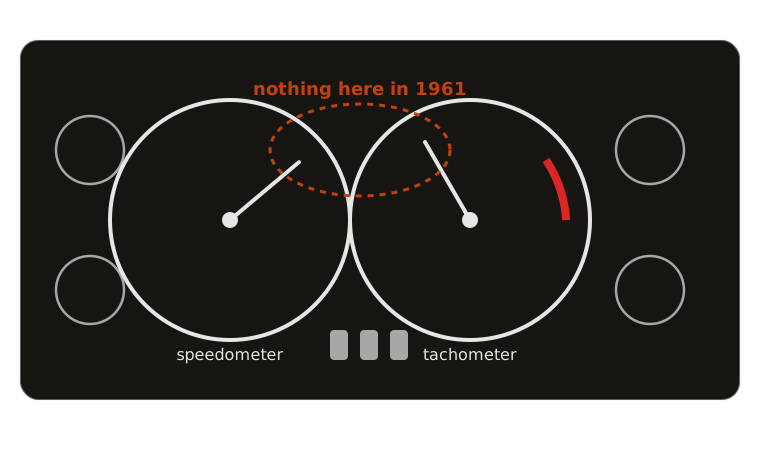
The Series 1 E-Type’s dashboard is two large matching circular dials — speedometer and tachometer — flanked by smaller gauges for oil pressure, water temperature, fuel and battery condition, all analogue, all continuous needles, set in engine-turned aluminium. There is no telltale light bank at all in the earliest cars: a fault shows up as a needle drifting into a marked danger zone, not as a discrete on/off signal. The driver’s job is continuous monitoring — reading trends, not waiting for alarms.
The MBUX Hyperscreen, by contrast, is a single curved glass panel spanning the width of the car, housing three displays (driver cluster, centre, and front-passenger screen) behind one seamless surface. Almost every reading — speed, range, climate, navigation, drive mode — is a software-rendered surface that can be reconfigured, restyled or replaced by an update; the instrument a Hyperscreen driver reads on Tuesday may not be laid out the same way on Wednesday.
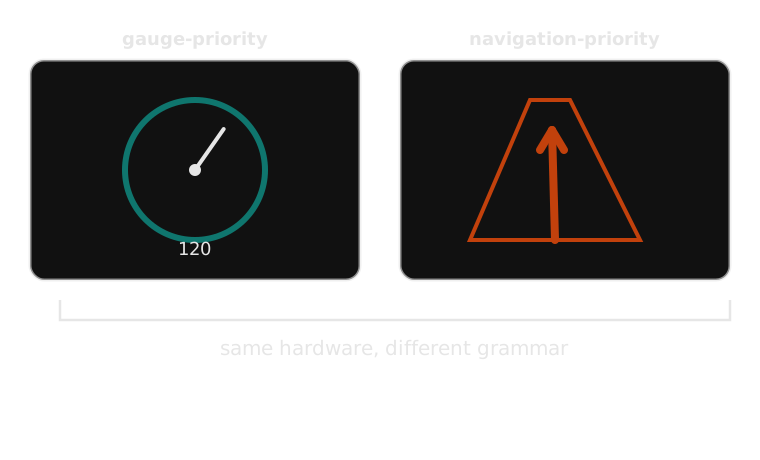
Same four questions — how fast, how much fuel, how hot, which way — answered by opposite grammars: one fixed, mechanical and non-negotiable; the other soft, configurable, mediated by software that can change the answer’s shape without changing the car underneath it. Neither is free: the E-Type cannot warn you of anything its designers didn’t wire a gauge for; the Hyperscreen can show you almost anything, which means someone has to keep deciding what it shouldn’t.
Every channel this course studies can be read against the same six questions — introduced in full here, and returned to every week from now on for that week’s specific channel:
- Urgency — how much time pressure is the driver actually under?
- Visibility — does this sit in foveal (direct) or peripheral vision?
- Meaning — is it self-explanatory, or does it need to be learned?
- Modality — sight, hearing, or touch?
- Timing — does it fire once, persist, escalate, or repeat?
- Required driver action — what, concretely, should the driver do?
A fuel gauge, read against these six: low urgency most of the time (escalating only near empty), foveal, self-explanatory once the E–F scale is known, visual, persistent for the whole drive, and requires no action until the trend gets close to the red.
Next week stays with pure analogue instrumentation and asks a narrower question: why Porsche puts the tachometer, not the speedometer, in the centre of the cluster.
Teaching team
- Marisol Quaye — convenor