Week 1 — The Dashboard as Language
What is a dashboard actually saying, to whom, and under what constraint?
Twelve weeks studying how cars talk to drivers — starting with the question underneath all of them.
Learning objectives
By the end of this week you should be able to:
- identify which of five channels (needle, light, icon, text, sound) a given dashboard element uses
- explain why a driver’s divided attention constrains dashboard design differently from a poster or a screen you sit and read
- compare the Jaguar E-Type’s analogue instrumentation with the Mercedes-Benz MBUX Hyperscreen’s software-rendered surfaces, feature for feature
- state what is gained and lost when a dashboard moves from a fixed needle to a reconfigurable digital display
- describe the six-stage path an event takes from sensor to driver response
Start small: the fuel gauge
Before the case study, an instrument almost nobody thinks about: the fuel gauge.
It answers one question — how much fuel is left — with a needle sweeping between E and F. It is calibrated to be imprecise near the middle and to matter most near empty, where the needle’s rate of movement, not just its position, becomes the real signal.
The car isn’t just reporting a fact. It’s making a bet about when you need to notice: not at three-quarters full, but as the needle approaches red.
What the fuel gauge is arguing
A fuel gauge with a low-fuel telltale added (standard on most cars since the 1980s) is really two instruments layered onto one measurement: the needle for trend, the light for a threshold that shouldn’t be missed even if you weren’t watching the needle.
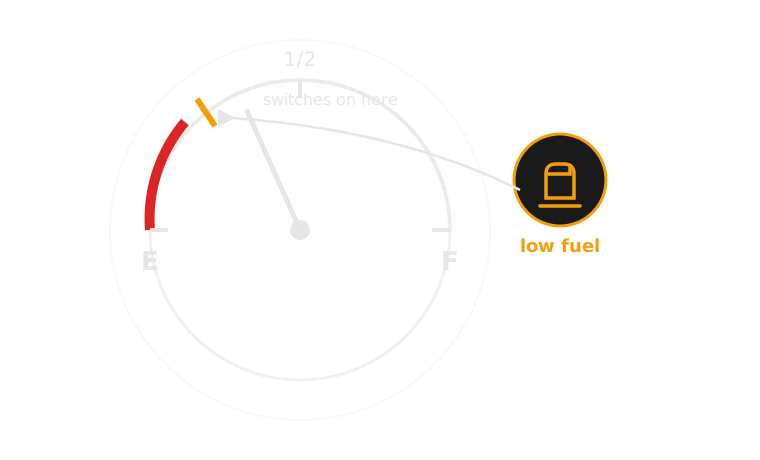
One measurement, two channels: a needle for trend, a light for threshold.
Five channels a dashboard can speak in
Every dashboard element is built from a small set of channels, and the choice between them is the design decision:
- needle / gauge — continuous, shows trend and rate of change
- discrete light (telltale) — binary, shows a threshold or fault state
- icon / pictogram — categorical, names what, not how much
- text — specific, but requires literacy and a moment of reading
- sound / voice — hard to miss, but can’t be glanced at and dismissed
Later weeks take each of these in turn — week 2 stays entirely inside the needle, week 3 is the light, week 4 the icon, week 6 the sound. This week’s job is just to notice the choice exists at all.
Comparison: needle vs light, same question
| Aspect | Continuous needle | Discrete light |
|---|---|---|
| Question answered | How much, and how fast is it changing? | Has a threshold been crossed? |
| Reading cost | Requires a glance and interpretation | Recognised almost instantly |
| Best for | Trends monitored over minutes (fuel, temperature) | Events you must not miss (low oil pressure, low fuel) |
| Failure mode if wrong choice | Driver ignores a slow drift toward danger | Driver has no idea how close to danger they are |
Neither channel is strictly better — the fuel gauge and the low-fuel light exist together because each covers the other’s blind spot.
Real example: Volvo and colour-coded telltales
Volvo’s instrument clusters have used a strict red/amber/green severity convention for decades, well ahead of it becoming an ISO-standard expectation (week 5 covers the standard itself). It matters here because Volvo treats colour as load-bearing information, not decoration: a red telltale on a Volvo dashboard has always meant “stop, now,” never “worth knowing eventually.” That consistency is a design choice a driver can learn once and reuse across every warning the car ever shows them.
Real example: Mazda’s analogue-anchored cluster
Mazda’s instrument clusters, from the third-generation Mazda3 onward, deliberately kept a large analogue-styled tachometer as the visual anchor of the cluster even as the surrounding readouts went digital. Mazda calls this “jinba ittai” instrumentation — rider and machine as one — and argues a driver reads rotational, at-a-glance information faster than digits. It’s useful here because it shows a manufacturer consciously keeping an analogue channel inside an otherwise digital cluster, rather than treating “digital” as an all-or-nothing upgrade.
Real example: Tesla and the disappearing cluster
The Tesla Model 3 and Model Y ship with no driver instrument cluster at all — speed, range and warnings all live on the centre touchscreen, in the driver’s peripheral vision rather than directly ahead. It’s the opposite bet from Mazda’s: Tesla treats the traditional gauge position as unnecessary if the same information is reachable by any glance. Whether that bet is correct is a genuine, still-open human-factors argument — and a preview of week 12’s software-defined dashboard.
The audience is a driver who is looking elsewhere
Design constraint, stated plainly: the primary reader of a dashboard is not looking at it. Eyes are on the road; the dashboard gets peripheral vision and quick downward glances, typically under two seconds each — sometimes at night, in rain, or with a passenger talking. This is why:
- glance-legibility usually beats precision
- colour and shape carry more of the message than size
- anything needing sustained reading (a paragraph of text) is close to useless as a warning
A museum label can ask for your attention. A dashboard has to earn it in under a second.
Getting the channel wrong has consequences
Choosing the wrong channel for the wrong kind of information isn’t a cosmetic failure — it changes what a driver actually notices. A single “check engine” light (week 3’s subject) can mean anything from a loose fuel cap to a failing catalytic converter; collapsing that whole range onto one undifferentiated light is a channel choice, made under real packaging and cost constraints, and it has a real cost: drivers learn to deprioritise a light that has cried wolf before. Week 10 returns to this directly, as alarm fatigue.
A cluster mid-transition
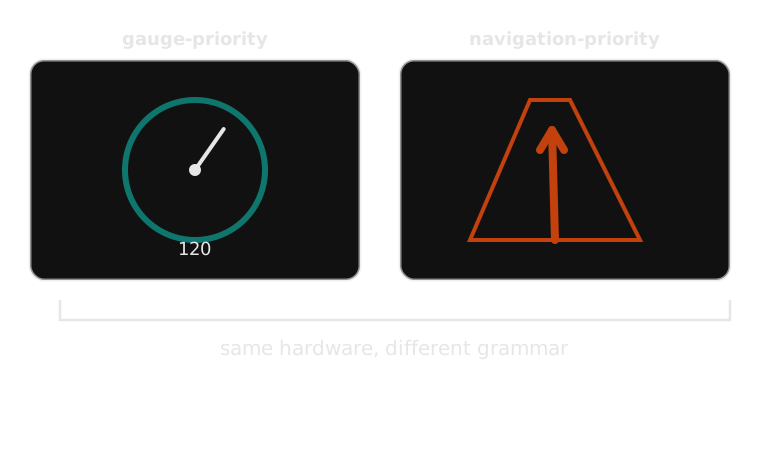
The instrument cluster as software: the same 12 inches of glass can be a speedometer or a map.
How an alert actually happens
A dashboard warning is the visible end of a six-stage process — worth naming precisely, because every later week revisits some stage of it:
- Sensor detects an event — e.g. a pressure switch drops below threshold
- Vehicle system interprets the event — normal range, a fault, or dangerous?
- System assigns an alert priority — informational, caution, or warning
- Alert is displayed — chosen channel: needle movement, light, icon, text, sound, or some combination
- Driver interprets the alert — recognises it, judges urgency, decides what it means
- Driver responds — ignores it, monitors it, or acts (pulls over, changes behaviour)
Most dashboard-design failures live in the gap between stage 3 and stage 4: a correctly detected, correctly prioritised event, communicated through the wrong channel.
The same process, as a diagram
1. Detect Sensor crosses a threshold
2. Interpret Normal, fault, or dangerous?
3. Prioritise Informational, caution, or warning
4. Display Needle, light, icon, text, sound
5. Driver reads Recognises, judges urgency
6. Responds Ignore, monitor, or act
Most failures live in the gap between stage 3 and stage 4 — this is the same argument as the previous slide, just redrawn as boxes for whichever version lands better in the room.
Five channels, one panel
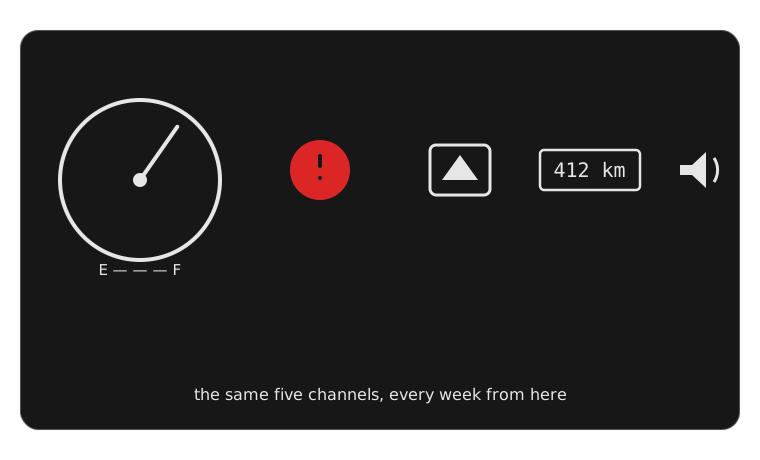
The same five channels return every week from here — only the choice between them changes.
Case study: two dashboards, one set of questions
Every dashboard, in any era, has to answer the same handful of questions: how fast, how much fuel, how hot, which way. What changes is the grammar used to answer them. Two cars sixty years apart make that as clear as it gets.
Jaguar E-Type Series 1 (1961)
Two large matching circular dials dominate the dashboard — speedometer and tachometer, equal in size and prominence — flanked by smaller gauges for oil pressure, water temperature, fuel level and battery condition. Every one of them is a continuous analogue needle set against engine-turned aluminium. Critically: the earliest E-Types have no telltale warning lights at all. A developing fault doesn’t announce itself with an on/off signal — it shows up as a needle drifting into a red-marked zone, which the driver is expected to already be watching for.
The design assumes an engaged, continuously monitoring driver, and a mechanically simple car with few distinct fault states to report.
What the E-Type’s dashboard is missing, on purpose
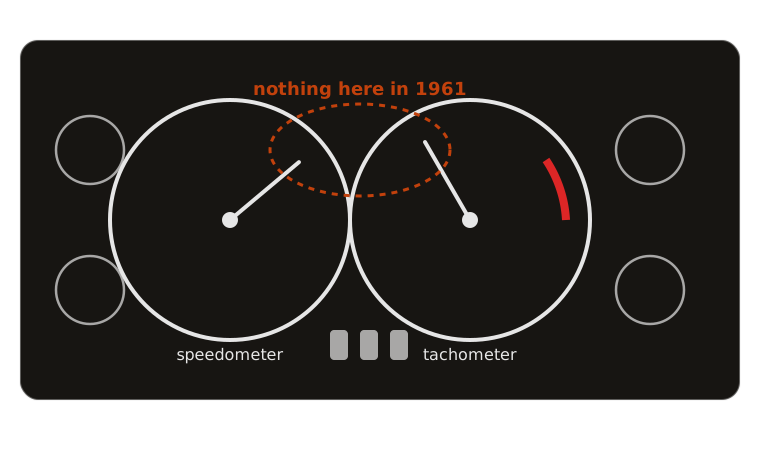
No idiot lights: every fault reads as a needle in the wrong place.
Mercedes-Benz MBUX Hyperscreen (2021)
A single curved glass panel spans the full width of the dashboard, housing three separate displays — driver cluster, centre infotainment, and front-passenger screen — behind one seamless surface. Almost every reading a driver takes is software-rendered: layout, colour, and even which instruments appear can change with a drive mode, a software update, or a setting the driver picked themselves.
Where the E-Type’s dashboard is a fixed set of promises made once, at the factory, the Hyperscreen’s is a live negotiation between driver preference and manufacturer software, re-decided every time the car starts.
Consequences, and a synthesis
The E-Type’s rigidity is also its guarantee: the tachometer is always in the same place, answering the same question, for the life of the car. Its weakness is that it can only ever warn about what a 1961 engineer thought to wire a gauge for.
The Hyperscreen’s flexibility is also its liability: it can show almost anything, which means a human keeps having to decide what it shouldn’t show, and a software update can silently change where the driver’s eye needs to go next. A plausible synthesis, worth debating rather than accepting: let the safety-critical core — speed, and a small fixed set of telltales — stay non-reconfigurable, no matter what mode or update touches everything else on the panel.
Comparison: analogue vs software-defined cluster
| Aspect | Jaguar E-Type (1961) | MBUX Hyperscreen (2021) |
|---|---|---|
| Physical form | Fixed circular dials, mechanical | One continuous glass panel, digital |
| Layout | Identical for the car’s whole life | Reconfigurable, can change with an update |
| Fault signalling | Needle drift into a marked zone | Software-rendered icon, colour, or message |
| Failure mode | Can’t report anything unplanned for | Can report anything, so must be curated |
| What the driver learns once | Where every needle lives, forever | A layout that may not be the same next drive |
A framework for every week from here
- Urgency — how much time pressure is the driver actually under?
- Visibility — foveal (direct) or peripheral vision?
- Meaning — self-explanatory, or does it need to be learned?
- Modality — sight, hearing, or touch?
- Timing — once, persistent, escalating, or repeating?
- Required driver action — what, concretely, should they do?
A fuel gauge, run through the six: low urgency most of the drive (escalating only near empty), foveal, self-explanatory once E–F is known, visual, persistent for the whole trip, and asks for no action until the trend approaches red.
Common misconception: “more channels means a safer car”
It’s tempting to read a modern dashboard’s larger number of lights, icons, chimes and text alerts as straightforwardly safer than the E-Type’s six bare needles — more information, more warning, more coverage. That’s half true, and it’s the half that misses the real cost.
Every additional channel is also an additional claim on the same scarce resource: a driver’s few hundred milliseconds of attention per glance. A dashboard with twelve possible alert channels doesn’t give a driver twelve times the attention to spend on them — it competes twelve ways for the same budget the E-Type spent on six. More channels can mean better-matched information (the right channel for the right urgency), or it can mean alarm fatigue (week 10’s subject) — the same crowding problem the check-engine light already causes with just one.
Classroom activity: classify your dashboard element
Working from the element you brought to class (or the fuel gauge if you didn’t):
- Which of the five channels (needle, light, icon, text, sound) does it use?
- Walk it through the six-stage process — where does your element’s design put the most effort: detection, interpretation, priority, or display?
- If you had to move it to a different channel, which would you choose, and what would the car gain or lose?
- Would your answer change if this were a Jaguar E-Type-era car, with no telltale lights available at all?
Exercise debrief: what a good answer looks like
There is no single correct classification — the useful answers cluster around two shapes:
- A confident single-channel answer with a named trade-off — e.g. “this is a light, and moving it to a needle would lose the instant recognition it needs at exactly the moment it fires”
- An answer that notices its element is already two channels layered together — most students’ brought-in elements (a fuel gauge with a low-fuel light, a speed readout with an overspeed chime) turn out to be exactly the layered pattern this week’s fuel-gauge example opened with
Either shape demonstrates the actual skill: naming which channel and why that channel, not just describing what the element looks like.
Mini knowledge check
- Name the channel a conventional oil-pressure gauge uses, and the channel a low-fuel warning typically uses. Why are they different?
- In the six-stage alert process, at which stage does a system decide how urgently to communicate an event?
- True or false: the Jaguar E-Type’s dashboard has no way of signalling a developing fault.
- Give one thing the MBUX Hyperscreen can do that the E-Type’s dashboard structurally cannot.
Summary
- A dashboard is a designed language, not a neutral report of measurements
- The choice of channel (needle, light, icon, text, sound) is itself the design decision, not an implementation detail
- Drivers read dashboards under real constraint: divided attention, seconds not minutes
- The E-Type and the Hyperscreen answer identical questions with opposite grammars — fixed-mechanical vs software-mediated
- Every alert, however it appears, has passed through the same six-stage process: detect, interpret, prioritise, display, interpret, respond
Next week: needles and gauges, the analogue century
This week established that a dashboard is a language with real design choices behind it. Next week stays entirely inside one channel — the continuous needle — for almost a century, before lights, icons or screens existed as options at all. The case in point: why Porsche centres the tachometer, not the speedometer, in its instrument cluster — which only makes sense once you take seriously that centring a gauge is itself a claim about what the driver is meant to be watching.
From needles to language
A century of analogue instruments, one software-rendered panel, and the same four questions underneath both. That’s week 1. Bring one dashboard element with you every week from here — the vocabulary keeps building on it.