Benchmark 00 / closed-form truth
A perfect score can miss the shape.
The candidates you start with never change; the measurement does. Each time the measurement is caught out, the bench gains a candidate built to show how.
- R Reference
- 0.00baseline
- A Location shift
- 5.12true FID
- B Spread shift
- 4.88true FID
- C Shape failure
- 0.00visibly wrong
The candidate the score cannot distinguish
FID 0.00.
Different distributions.
R has one peak. C has two. Their mean and covariance agree exactly, so FID assigns zero distance to distributions with different shapes.
Two peaks survive in C. The Gaussian reference has only one.
- Mean · both
- 0
- Covariance · both
- I
- Population FID
- 0.00
Exact densities along e₁. C mixes two Gaussians equally, with means ±0.9 and component variance 0.19 on this axis; the other 2,047 coordinates match R. Zero is the population score, not a guarantee for finite samples.
Follow the failure in week 6 →Open defectA lower number does not guarantee a better distribution.
Who it is for
Postgraduates who have trained or evaluated a generative model at least once, and have read a results table without asking what N was. Assumes comfort with multivariate Gaussians, matrix decompositions, and Python with NumPy.
Not for anyone who wants to learn to build generative models; this course never trains one. Not for anyone who needs the number to be fine.
What you will do
Build a bench in week 1: a reference distribution and two candidates, small enough to run on a laptop and simple enough that every score has a closed form. Re-score it every week with that week’s method. Reproduce a published number and account for the gap. Construct a candidate the score gets wrong. Propose a replacement and judge it by the same standard. Keep a log.
What you leave with
You can read a reported FID and say what it depends on: the number of samples, the network that made the features, the reference set and the seed. You can estimate how far a score at your N sits above its limit, and tell whether the gap between two models is larger than that. You can build a distribution the score gets wrong, and write a report that states the protocol beside the number. A results table that leaves the protocol out will read to you as unfinished, and that change is what the twelve weeks are for.
Twelve weeks
A zero score is the beginning of the audit. Build the measurement, expose what it misses, then decide what deserves to count as evidence.
Arc ACompute it
Establish what the number measures and reproduce it under controlled conditions.
The number
The bold number in a results table is the field's account of what got better, and nothing in the table says what it was computed against. The bench is built here.
The Fréchet distance
The closed form for two Gaussians, derived rather than quoted, and the assumption it smuggles in
The instrument
Inception-v3 was trained to name a thousand ImageNet classes. The score measures distance in the space it built to do that.
Getting it right
The same samples can receive different scores. Separate preprocessing from numerical arithmetic, then pin the protocol you can defend.
Arc BBreak it
Test the assumptions: sample bias, missing shape, and what changes beyond images.
The bias
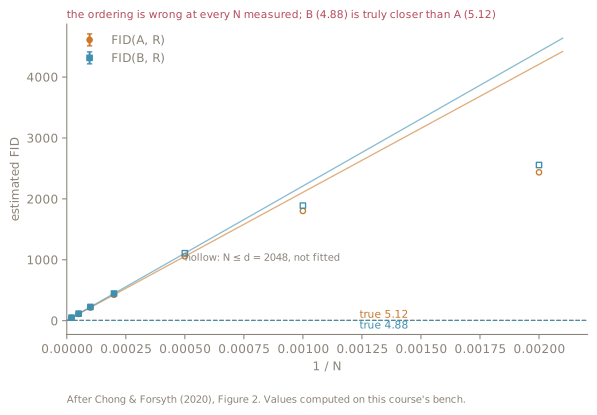
Finite-sample FID is biased, the bias depends on the generator, and fixing N does not repair the comparison
Blind spots
A generator that memorised the reference set scores perfectly. What else the score cannot see, demonstrated on the bench.
Dropping the Gaussian
An unbiased estimator need not detect every difference. Compare KID, density and coverage against the bench's known Gaussian-distance baseline.
Video
FVD keeps the Gaussian distance but changes the features. Test what a temporal instrument preserves before transferring claims from images.
Arc CLive with it
Compare the score with human judgement and decide what evidence to report.
Human evaluation
The judgement the score stands in for. How a rating study is designed, what it costs, and why it is so rarely run.
Correlation
Put the ranking a score produces beside the ranking people produce, and ask whether they agree. That question decides whether the previous nine weeks were worth doing.
Why it persists
Nine years of results tables carry an FID column, and that continuity is the strongest argument anyone has for keeping it. What the number costs to leave out, stated honestly.
What you would report instead
Defend your proposal by the standard built across the semester. Bring the final bench comparison and the conditions under which you would still report FID.
The bench
It starts as one reference set and two candidates, in the 2048 dimensions a feature extractor would have produced, chosen so that every score has a closed form and can be checked by hand. It does not stay that size. Every candidate after B arrives in the week the score is caught out.
- R
- N(0, I). The reference set.
- A
- N(0.05·1, I). Mean shifted, covariance untouched. FID 5.12.
- B
- N(0, 1.1·I). Mean exact, covariance too wide. FID 4.88.
- C
- Week 6. A bimodal mixture with R’s mean and R’s covariance. FID 0, and visibly wrong.
- D
- Week 6, and yours. Scores worse than A while looking closer to R, under a measure you write down before you look at the number.
- E
- Week 8, once the recordings have time in them. Every frame raised by the same amount.
- F
- Week 8. Every frame kept, their order destroyed. Two instruments disagree about whether E or F is the worse candidate.
Where to go next
Lectures
A live bench in week 1, then four lectures. From week 5 each puts an instrument in the page, so you produce the failure before the lecture names it.
Sessions
Twelve weeks on one bench, each re-scoring it with that week’s method.
Assessment
Reproduce a published number in week 5 and break one in week 9. The final report proposes what to print instead, and the measurement log runs under all of it.
Workspace
Python and a maths lab in the browser, for the experiments the sessions set. Nothing to install.
Memes
A tempting claim, a check, and a better conclusion. Collect seventeen optional GPT and Claude comics through the lecture and session self-checks.
People
The convenor, and the tutor who holds the seed and re-scores the bench every Monday.
Policies
The rules every assessment links to, stated once, and a calculator for planning your grade.