Factorio: Engineering Addiction
Week 8 — Diagnosing the Factory
Brownouts
When demand outstrips supply, the network doesn’t pick winners and losers — every machine on it slows down together, in proportion to how much power it’s actually getting.
- if a network needs 300 kW total but only 180 kW is available, every machine on it runs at 60% speed (180/300), not some machines at full speed and others off
- because the slowdown is even and proportional, a brownout shows up everywhere at once — which is exactly why it’s easy to mistake for a bottleneck in whatever line you happen to be looking at
Brownouts, continued
- a stopped machine still draws power just for existing on the network, separately from the power it draws while working — an assembling machine 1’s drain is 3 kW, on top of 90 kW of consumption while it’s actually crafting, so an idle machine isn’t a zero-demand machine
- the brownout itself is a symptom: the actual fault is upstream, in generation capacity or accumulator charge, not in the slowed machines themselves
Brownouts, in practice
Source: Factorio Wiki, CC BY-NC-SA 3.0.
Every machine in this clip slows by the same fraction at the same moment — that shared, simultaneous slowdown is the brownout signature the next slide’s info screen puts a number on.
Electric network info, in practice
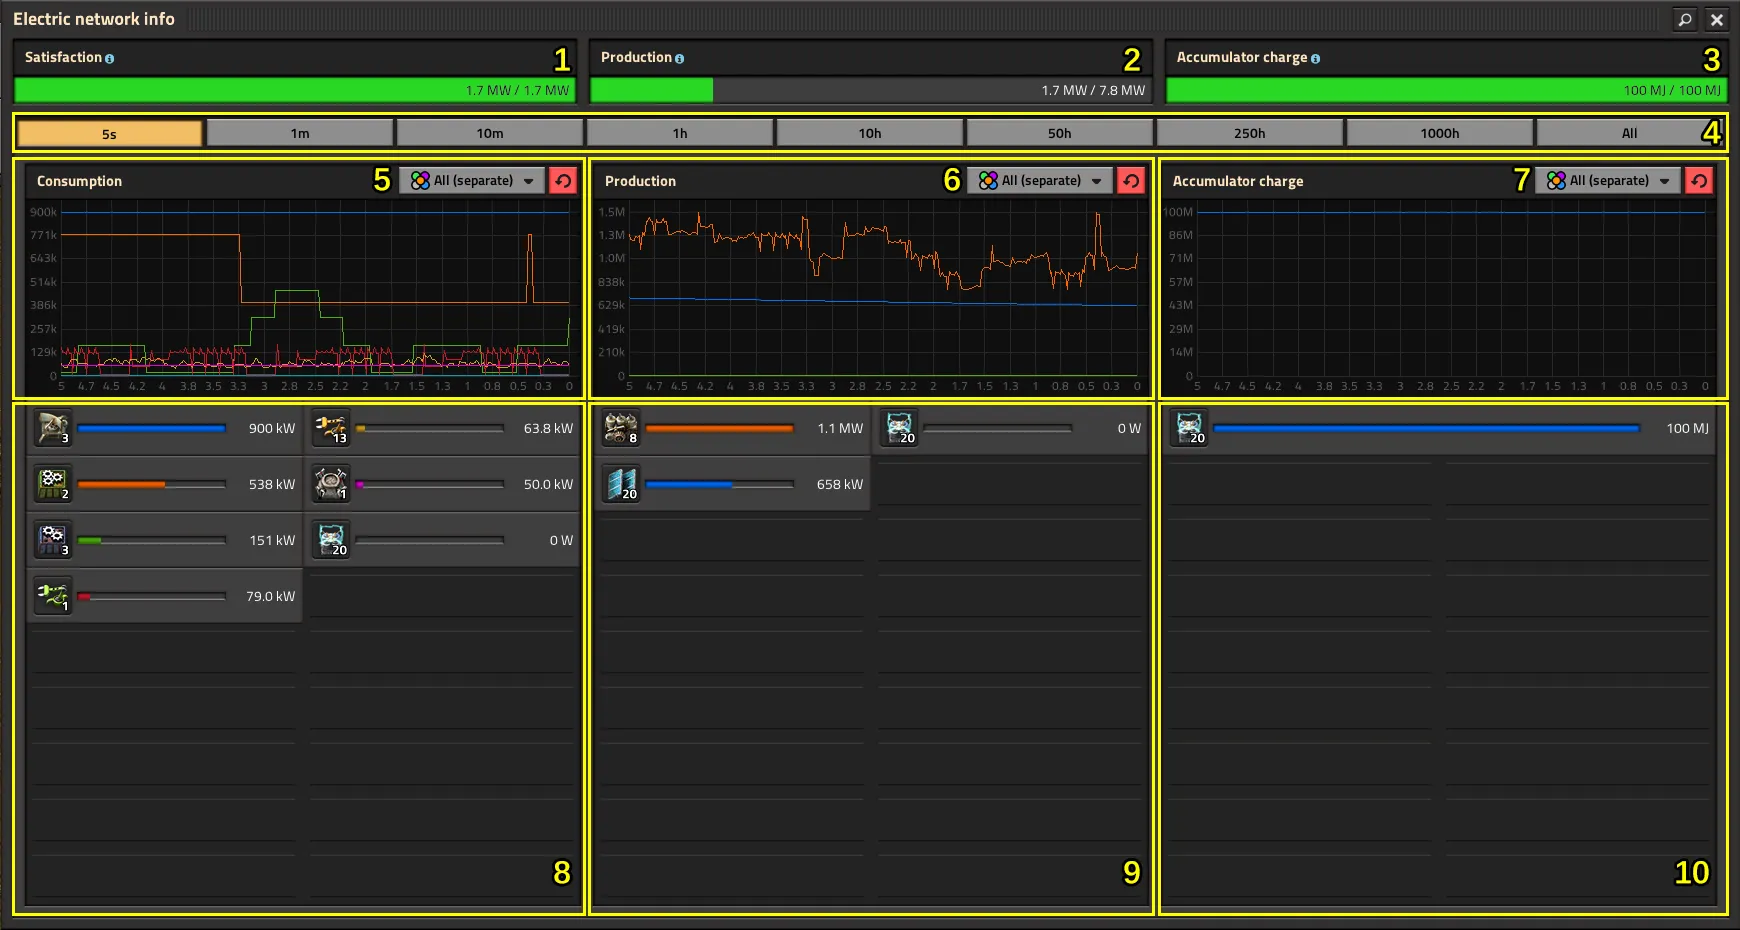
Source: Factorio Wiki, CC BY-NC-SA 3.0.
Satisfaction below 100% is the tell — check this screen before touching any individual machine, since a slow assembler here is innocent.
Generation priority
When a network has more than one kind of generator, demand isn’t split evenly between them — it’s satisfied in a fixed order, and that order is itself a diagnostic tool.
- solar panels first — they run at full output whenever daylight allows, and only throttle down once they alone already cover 100% of demand
- steam engines, steam turbines and (Nauvis) fusion generators share next, at equal priority to each other — whatever solar didn’t cover, they split between themselves
Generation priority, continued
- accumulators are strictly last resort: they only discharge once every other source is already maxed out and demand still isn’t met, and they only charge once every source has fully met demand with surplus left over
- this ordering is why a brownout at night with steam backup still running fine points at insufficient steam capacity, not at accumulators — accumulators were never going to be asked for more than steam already refused to cover
Why solar
Steam and nuclear both need a continuous fuel supply; solar’s whole appeal is not needing one.
- no fuel logistics, and (with enough accumulators) no exposure to a biter attack cutting a fuel line — a boiler or reactor cut off from fuel stops producing, solar just draws down stored charge
- it’s also the cheapest power source to simulate: panels and accumulators are calculated in bulk across the network, while boilers and especially nuclear reactors carry real per-segment fluid simulation cost — at megabase scale this UPS difference is usually the deciding factor, ahead of raw power density
Why solar, continued
- the trade-off is footprint and upfront cost: nuclear packs far more power per tile once built, solar just needs more panels laid down over time
- on the supply side, the same offshore-pump ratio scales the same way it did in Week 1: one offshore pump supplies enough water for 200 boilers and 400 steam engines — check that ratio against actual demand before assuming a steam shortfall is a diagnosis rather than a guess
Solar and accumulator ratio
A solar field alone only covers daylight — accumulators are what carries that surplus through the night, and the two have to be sized together against each other, not separately.
- the documented full day-night ratio on Nauvis is 25 solar panels to 21 accumulators (normal quality) for a self-sufficient network — roughly 0.84 per panel, often rounded to 6:5 for quick sizing; sizing panels directly against total demand takes 23.8 panels per megawatt required
- undersizing accumulators against panel count doesn’t show up during the day — it shows up as a brownout a few hours after sunset, once stored charge runs out
Solar and accumulator ratio, continued
- oversizing panels without matching accumulators wastes daytime surplus — the ratio, not the raw panel count, decides whether the base survives the night
- running out of stored charge isn’t the only accumulator failure mode — each one caps its discharge at 300 kW no matter how much energy it’s holding, so a sudden heavy load (a laser wall opening fire) can brown out a fully-charged accumulator bank simply because it can’t push power out fast enough
- steam storage doesn’t have this ceiling nearly as low: a steam engine discharges stored steam at 900 kW, a turbine at 5,800 kW — three and roughly six times an accumulator’s rate — which is why a burst-load network leans on stored steam, not stored charge, for headroom
Storage tanks as energy banks
Steam isn’t only useful for its discharge rate — a storage tank also banks the same energy far more densely than an accumulator array does.
- one tank of 165°C boiler steam holds 750 MJ, the same as 150 accumulators; one tank of 500°C heat-exchanger steam holds 2,400 MJ, the same as 480 accumulators
- in the same 3×3 footprint, an accumulator array holding that much charge would need roughly a hundred tiles more to match
Solar and accumulator ratio, in practice
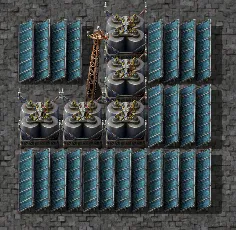
Source: Factorio Wiki, CC BY-NC-SA 3.0.
A block sized once like this tiles cleanly across a field — sizing panels and accumulators separately, then bolting them together after the fact, is how the ratio drifts off without anyone deciding it should.
Pole networks
A network that looks like it should be one continuous grid can split into two without any visible gap in coverage — the cause is usually the poles themselves, not a missing connection.
- a newly-placed pole auto-connects to the nearest available poles, but the game refuses to complete a 3-pole triangle — if two poles are already connected to each other, a third pole won’t form the closing side of that triangle even if it’s in range of both
Pole networks, continued
- no pole connects to more than 5 others at once — past that, the auto-connect logic skips it in favour of poles with room left, which can silently route power around a busy junction pole instead of through it
- both rules only affect auto-connection — manually dragging a wire with the copper wire tool can still form a triangle or a 6th connection on purpose, which is sometimes exactly what a segmented network needs
Identifying bottlenecks
Guessing which machine is “the” bottleneck wastes time — the same symptom can come from three different layers, checked in order from the ground up.
- Machine utilisation — running, or idle waiting on an ingredient? The status icon says which.
- Buffer levels — is a buffer or output slot full or empty? Full means downstream is the constraint; empty means upstream is.
- Belt saturation — is the belt at capacity between two points that are each fine alone? Neither machine beside it can see that.
Checking in order finds the actual constraint, not the first slow-looking machine you notice.
Parallel versus series production
Once a line is bottlenecked, there are exactly two ways to add capacity — build another line beside it, or make the existing line faster — and they aren’t interchangeable once ratios are already tight.
- parallel (another identical line) adds throughput linearly and doesn’t touch the existing ratio, but costs the footprint and input supply of a whole second line
- series (speed modules, beacons, or a faster machine tier on the same line) raises throughput without adding footprint, but changes the machine’s input consumption rate — every ratio feeding that machine has to be rechecked, not just the machine itself
- speeding up one step in an already-tight chain without touching the others just moves the bottleneck one step over, it doesn’t remove it
Discussion: the everlasting chip shortage
Green circuits are usually the first thing a growing base runs short of, and “build another green circuit line” is rarely the whole fix, because circuits sit at the base of almost every other recipe.
- demand for green circuits grows with nearly everything else being built, so a shortage here isn’t isolated the way a shortage of a specialised intermediate would be
- adding a parallel green-circuit line without checking what it’s now competing with for copper and iron plate can just relocate the shortage one step upstream
- this is this week’s diagnostic method applied to a specific, practically inevitable case: check utilisation, buffers and saturation before assuming “more circuits” is the fix
A brownout tells you the network is short on power. It doesn’t tell you which machine to blame — that’s a different question, checked a different way.
Diagnosis is a sequence, not a guess: identify which layer the symptom is actually coming from before changing anything.
This week’s practical
Goal: diagnose a supplied base showing a brownout and an unrelated
      bottleneck, and fix both root causes — Assignment 1 is due this week
Test: check utilisation, buffer levels and belt saturation in order,
      keeping the power problem and the production problem separate
Pass: the brownout's root cause is identified, not just the symptom; the
      unrelated bottleneck is correctly separated from the power issue;
      both are fixed, and the fix for one didn't mask or worsen the other
The same method — checked in the same order — is what Assignment 1 expects you to demonstrate in writing.