Week 2: Needles and Gauges — The Analogue Century
Why did continuous analogue gauges dominate for a century, and what did they assume about the person reading them?
For most of the twentieth century, a car had almost nothing to say to its driver except through a needle, a printed arc, and the driver’s own memory of where that needle “usually” sits.
Learning objectives
By the end of this week you should be able to:
- Identify the difference between continuous and discrete instrument information, with one real example of each.
- Explain why an analogue gauge assumes a trained reader, not just a literate one — and what “trained” means here.
- Compare Porsche’s centred-tachometer layout against a mainstream centred-speedometer layout, and state what each design claims matters most to its driver.
- Describe the step-by-step process a driver runs through to read a gauge and decide whether to act on it.
- Predict what a car loses, informationally, when a continuous gauge is replaced by a single on/off light — this week’s bridge into week 3.
Opening example: a speedometer that says nothing in words
Picture the simplest possible instrument: a single needle, a printed arc from 0 to 240 km/h, no digits highlighted, no colour zones. This was the entire vocabulary of most cars built between 1920 and 1990.
The driver reads it not as a number but as an angle. At a glance, “needle pointing slightly left of twelve o’clock” means something different from “needle near the top of the arc” — but only if the driver has already learned, through hundreds of previous glances, roughly where the needle sits at motorway speed versus suburban speed.
This is the opening puzzle for the week: the gauge communicates constantly, but it communicates almost nothing to someone who has never driven that car before.
The same problem, a second instrument
Put a tachometer next to that speedometer and the puzzle sharpens. Its arc usually runs from 0 to 7,000 or 8,000 rpm, with a red zone printed near the top. Unlike the speedometer, there is no legal number here, no posted limit — the driver is being asked to keep the needle inside a zone the car considers safe for its own mechanism.
This is the first hint of the week’s real subject: a gauge doesn’t just display a quantity, it makes a claim about what the driver needs to watch, and how urgently.
A century of the same format
From roughly 1900 (the first speedometers) to the 1990s (when digital instrument clusters became cheap enough for mainstream cars), the dominant dashboard format barely changed: circular dials, printed scales, a swept needle, sometimes a printed zone in a second colour.
Manufacturers changed the styling, the typography, the number of dials — the Jaguar E-Type (Week 1) put oil pressure, water temperature, fuel and battery charge in four small dials either side of two large ones for speed and revs — but the underlying grammar stayed constant: continuous position implies continuous information.
That stability is worth explaining on its own terms. It wasn’t for lack of alternatives — idiot lights existed from the 1930s onward for exactly the failures gauges already covered (Week 3) — but manufacturers kept the gauge as the default for anything the driver might need to monitor over time, not just be alerted to once.
Continuous signal vs discrete event
This is the conceptual distinction the whole week turns on.
- A discrete signal has two states: fine / not fine. A warning light is discrete — it is either off or on.
- A continuous signal has a position along a scale, and that position keeps changing whether or not anything is wrong.
An oil-pressure gauge lets a driver notice pressure easing down over several minutes, long before it would trip a warning light — because the gauge reports the ongoing state, not a threshold crossing. That difference is diagnostic: a slow drift is a different problem from a sudden drop, and only a continuous readout tells them apart.
The trade-off: continuous information takes longer to interpret and depends on the driver already knowing what “normal” looks like. Week 3 is about what happens once manufacturers decided that trade-off wasn’t worth it for most drivers, most of the time.
The assumption baked into every needle
A gauge only communicates if its reader already carries a mental reference: “at this speed, on this road, the needle usually sits about here.”
That reference isn’t printed on the dial. It’s built by repetition — a few weeks of driving the same car — and it doesn’t transfer well. Rent a car with an unfamiliar tachometer and the red zone is legible instantly (it’s printed in red), but the normal cruising position isn’t; you learn it by watching the needle for the first hour, not by reading a label.
This is the sense in which analogue gauges assume a specific kind of driver: someone who drives this car, or cars very like it, often enough to have memorised its baseline. Fleet vehicles, rental cars, and first-time drivers of a model are exactly the situations where that assumption breaks down.
What the earliest dashboards actually gave the driver
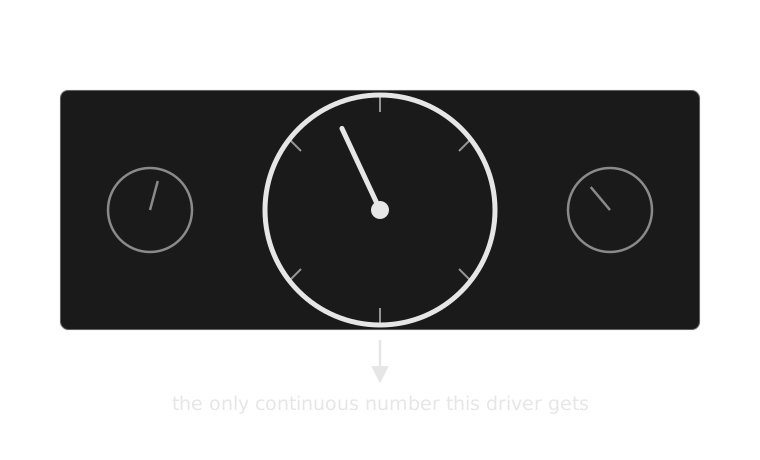
Before the dashboard had a vocabulary, it had one word.
Even once amperage, oil-pressure and water-temperature gauges became common through the 1940s–50s, the format was the same for each: a dial, a needle, a printed scale. The vocabulary grew one word at a time; the grammar — sweep needle, printed arc — never changed.
The grammar of the dial itself
Once a gauge has more than a bare number, three further conventions appear almost everywhere by mid-century:
- A printed scale — usually non-linear near the ends, compressed where precision matters less.
- A colour zone — green or unmarked for normal operation, red for a zone the car should never sit in (redline, overheat).
- A needle rest position — many gauges are designed so “all fine” sits near the same clock position (often just past twelve), so a practised driver can sanity-check several gauges in one glance without reading any of them individually.
That third convention is the one closest to this week’s case study: manufacturers didn’t just decide what to show, they decided where on the dashboard to put it, and that placement is itself part of the message.
How a driver actually reads a gauge under time pressure
The reading is a chain, not a single perception, and every step can fail:
| Step | What happens | Where it can go wrong |
|---|---|---|
| 1. Locate | Eye finds the gauge’s position on the dash | Unfamiliar layout, gauge not centred in view |
| 2. Perceive | Needle angle registers | Poor lighting, needle obscured by wheel |
| 3. Recall | Angle is compared to a remembered “normal” zone | No memorised baseline (rental car, new driver) |
| 4. Judge | Deviation from normal is assessed | Ambiguous zone boundary, gradual drift under-noticed |
| 5. Decide | Driver decides whether to act now, soon, or not at all | Time pressure collapses steps 3–4 into a guess |
Steps 3 and 4 are where analogue gauges are most fragile: they depend on a memory the driver had to build beforehand, under no time pressure at all, so that it’s available in the half-second glance when pressure is high.
The same chain, as a diagram
1. Locate Eye finds the gauge’s position on the dash
2. Perceive Needle angle registers
3. Recall Angle compared to a remembered “normal” zone
4. Judge Deviation from normal is assessed
5. Decide Act now, soon, or not at all
Stages 3 and 4 are where an unfamiliar car breaks the chain — there is nothing printed on the dial that substitutes for the memory those two stages assume.
Real example: Volvo’s legibility-first cluster (240 series, 1970s–90s)
Volvo’s 240-series dashboard applies the same needle-and-arc grammar with an explicit design priority: legibility over density. Large numerals, high-contrast markings, a limited instrument count (speed, fuel, temperature, sometimes a clock) — nothing decorative competing for attention.
It’s useful for this week specifically because it shows that “analogue” doesn’t mean “one design” — the format is a shared grammar, but a manufacturer still chooses which words to include and how loudly to print them. Volvo’s choice reflects a brand priority (safety, clarity) as much as Porsche’s choice reflects a different one (engine awareness).
Real example: Mazda MX-5 (NA, 1989–97)
The original Miata’s cluster puts a full-size tachometer and speedometer side by side, near-identical in size — deliberately refusing to let either dominate. Mazda’s own design brief for the car emphasised driver feedback and jinba ittai (horse and rider as one); an equal-sized tachometer next to the speedometer is a small, legible instance of that philosophy: this is a car that wants the driver watching engine behaviour and road speed with equal attention, not one subordinated to the other.
It’s a useful middle case between this week’s two poles — it doesn’t go as far as Porsche’s tach-dominant layout, but it clearly refuses the mainstream default of speedometer-first.
A second comparison, before the case study: sweep needle vs digital bar-graph
Many 2020s instrument clusters, including digital displays in mainstream Honda and Toyota models, render a tachometer as a horizontal or arced bar of illuminated segments rather than a swept needle.
| Aspect | Sweep needle | Digital bar-graph |
|---|---|---|
| Precision at a glance | Low — angle read approximately | Higher — segment count is more discrete |
| Rate-of-change visibility | High — motion is continuous, easy to track peripherally | Lower — segments step rather than sweep |
| Failure mode | Depends on memorised “normal” position | Often paired with a numeral, reducing that dependency |
| Manufacturing flexibility | Fixed once printed | Reconfigurable in software |
The rate-of-change row matters most for this week’s argument: a swept needle is unusually good, in peripheral vision, at signalling that something is changing, independent of whether the driver consciously reads the exact value. That property is largely what a discrete light (Week 3) and a stepped digital bar both give up.
Looking closely at a gauge’s rest position
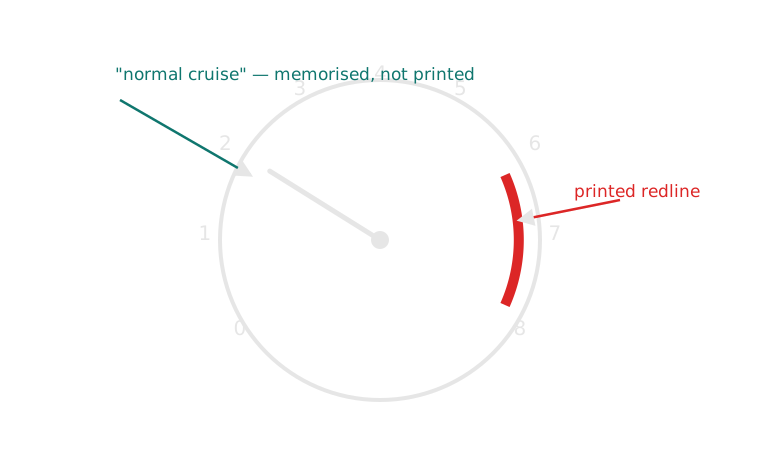
The dial prints the danger zone. It never prints the safe one.
That gap — a printed danger zone but no printed “normal” zone — is exactly the gap a trained reader fills from memory, and exactly the gap this week’s case study is about to make into its central design decision.
Case study: Porsche puts the tachometer in the middle
Porsche’s driver’s cluster — established with the 356 in the 1950s and carried through every 911 generation since, including current cars — puts the tachometer, not the speedometer, in the largest, most central position directly ahead of the driver. The speedometer sits to one side, smaller or equally sized but never centred.
This is not an accident of history repeated by inertia; Porsche has kept the layout through digital-instrument transitions where it would have been trivial to swap the priority. The company’s own literature has described the tachometer as the instrument “you actually drive by” in a car whose engine note and rev range are central to how it’s meant to be operated.
What centring the tachometer assumes about the driver
Centring the tach makes a specific claim: in this car, engine load is the number you need fastest, faster than road speed, because a driver working the gearbox and the throttle near the engine’s performance band needs a continuous readout of where in that band they currently are, in the same reflexive glance they’d otherwise spend on speed.
Consequences:
- Strength: the driver’s fastest, least-effortful glance lands on the number that matters most for how the car is being driven, not just how fast it’s travelling.
- Weakness: road speed becomes a secondary glance — in a car capable of covering a speed limit almost silently, that’s a genuine risk the layout accepts in exchange for its priority.
- Consequence: the layout only makes sense for a driver expected to actively manage engine speed (through gear choice) as part of normal driving, not just point the car and press a pedal.
The mainstream default, and a synthesis
Most family cars — a Toyota Camry, a Honda Accord, a Volkswagen Golf in its everyday trims — centre the speedometer instead, with the tachometer smaller, to one side, or reduced to a digital readout. That layout makes the opposite claim: the number the driver needs fastest is the one with legal and safety consequences attached to it directly — the posted limit — and engine behaviour is background information an automatic transmission mostly manages for them.
Neither layout is simply correct; each optimises for a different relationship between driver and machine. A synthesis worth proposing to students: a layout that lets drive mode (sport vs comfort/eco) re-centre the priority instrument electronically — something only a reconfigurable digital cluster (foreshadowing weeks 8–12) can actually do, since a printed analogue dial can’t swap which gauge is biggest depending on context.
Side by side: two layouts, two claims
| Aspect | Porsche (tach-centred) | Mainstream (speedo-centred) |
|---|---|---|
| Centred instrument | Tachometer | Speedometer |
| Implicit claim | Engine load is the fastest-needed number | Road speed is the fastest-needed number |
| Assumes a driver who… | Actively manages engine speed via gear choice | Is regulated primarily by posted limits |
| Speedometer’s role | Secondary, still present, smaller/offset | Primary, largest dial |
| Where it appears | Porsche 356 through current 911/Cayman/Boxster | Camry, Accord, Golf, most mainstream sedans/hatches |
Reading a mainstream cluster the same way
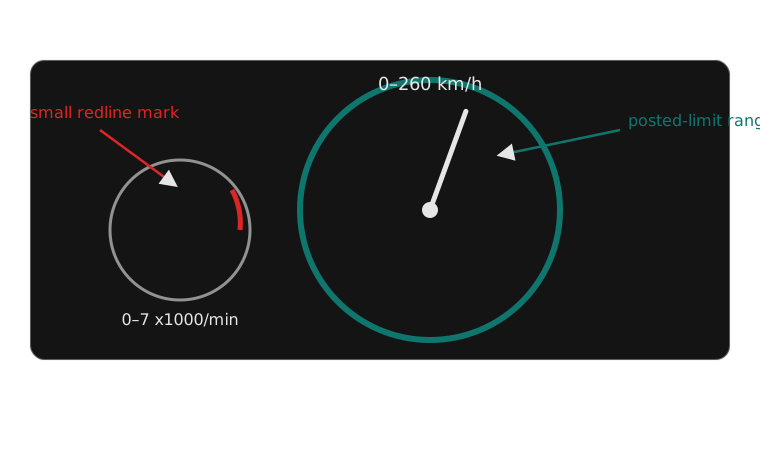
Same grammar, opposite priority — the biggest dial is the one with a legal number attached.
Place this image next to the Porsche cluster from an earlier slide and the comparison teaches itself: both use dials, arcs and needles, and still disagree about what a driver most needs to see first.
This week’s channel, against the framework
- Urgency — low to medium for most of a drive; a needle rarely spikes urgency on its own
- Visibility — foveal only — never used for anything peripheral
- Meaning — has to be learned; nothing on the dial marks “normal”
- Modality — visual only
- Timing — continuous, not a single event
- Required driver action — usually “nothing yet” — the needle’s value is letting a trend be noticed before any one reading would demand action
Common misconception: “a bigger dial is just a styling choice”
It’s easy to read Porsche centring the tachometer, or a Camry centring the speedometer, as brand aesthetics — sportscar versus family car, nothing more substantive than badge design.
That undersells what a centred dial actually costs the driver: the biggest, most central position is also the fastest, least-effortful glance on the whole dashboard. Assigning it to one instrument is a permanent decision about which number this car considers most urgent, made once at the factory and then never revisited for the life of the car (unlike a reconfigurable digital cluster, week 8 onward). Two manufacturers who made that decision differently weren’t expressing taste — they were making incompatible claims about what their driver needs fastest.
Exercise: argue for a re-centred cluster
Pick a vehicle type that isn’t a sports car or a mainstream sedan — a delivery van, a long-haul truck, a car intended mainly for learner drivers, or an electric city car with no engine to rev.
In groups, decide:
- Which single instrument should be centred and largest for this driver’s actual priorities, and why?
- What existing convention (Porsche’s tach-centred, or the mainstream speedo-centred layout) does your answer resemble, if either?
- Would your chosen layout survive the trained-reader problem — could a first-time driver of this vehicle read your centred instrument’s “normal” zone without prior experience?
Exercise debrief: a model answer
Most groups land on one of two directions:
- Delivery van / long-haul truck — centring a load or engine-temperature gauge over the tachometer, since the driver already manages a much wider, more forgiving rev range than a sports car and the more urgent number is the vehicle’s own mechanical health over a long shift
- Electric city car — centring a power/regeneration gauge in the tachometer’s old position, since there’s no engine speed to manage but there is a genuinely new continuous quantity (how hard the motor is working, in which direction) that a driver benefits from watching
Both directions demonstrate the actual skill this exercise tests: the layout question was never “which of the two conventions do you prefer” — it’s “what does this driver, in this vehicle, need fastest,” and sometimes the honest answer is neither existing convention, which is worth more credit than confidently picking one.
Studio preview: read three clusters, argue about priority
Bring (or find online) driver’s-eye photographs of three dashboards from different classes of car — for example, one performance car, one mainstream family car, one commercial or fleet vehicle.
For each, work out:
- Which instrument is centred and largest?
- What does that placement claim matters most to the driver?
- Would a first-time driver of this exact car be able to read the “normal” zone of that instrument without having driven it before?
- If you swapped this car’s centred instrument for its neighbour’s, what would break about the driving experience it’s designed for?
Mini knowledge check
- What is the difference between a continuous signal and a discrete signal, in one sentence each?
- Why can’t a first-time renter of a car reliably read its tachometer’s “normal” cruising position, even though the redline is clearly printed?
- Porsche centres the tachometer; a Toyota Camry centres the speedometer. State, in one sentence each, what claim each layout makes about its driver.
- Name one thing a swept analogue needle communicates in peripheral vision that a single on/off light (next week’s topic) cannot.
Summary
- Analogue gauges dominated for a century because they show continuous state, not just threshold crossings — valuable for anything a driver needs to monitor over time, not just be alerted to once.
- That format assumes a trained reader: someone who already knows, from repetition, where the needle sits when everything is fine, since dials print danger zones but rarely print the normal one.
- Where a gauge sits on the dashboard is itself part of the message — Porsche’s centred tachometer and a mainstream centred speedometer are the same grammar making opposite claims about what the driver needs fastest.
- Reading a gauge under time pressure is a five-step chain (locate, perceive, recall, judge, decide), and the middle two steps are exactly where the trained-reader assumption can fail.
Bridge to week 3: what happens when the needle becomes a light
Everything this week described — a printed danger zone, a memorised normal position, a continuous readout a driver could watch drift over minutes — assumes the driver has time and training to use it.
From the 1950s–60s, US manufacturers began replacing oil-pressure and ammeter gauges with a single warning light: no zone, no drift, no memorised baseline required, just off or on. Week 3 asks what that trade gained (a message any driver, trained or not, can read instantly) and what it threw away (the slow-drift information a gauge alone could show) — using the same oil-pressure instrument this week already introduced as the through-line between the two weeks.
From a century of needles to one light
Next week: the idiot light — what a dashboard gains, and loses, when a continuous gauge becomes a single on/off signal.